
")
- Purpose and scope
This report provides a comprehensive analysis of Kenya’s monthly export values, in Kenyan Shillings (Ksh, million), to selected African countries from January 1998 through May 2025. Compiled and published by the Afrique Center for Statistics, Artificial Intelligence & Innovation Research (ACSAIR), it examines overall trends, country-level patterns, seasonal variations, recent developments, and the latest rankings of destination markets. The focus is on ten key partner countries, Uganda, Tanzania, Zambia, Egypt, Rwanda, Zimbabwe, Ethiopia, Somalia, South Africa, and the Democratic Republic of the Congo (DRC), along with an aggregate “Other” category representing all other African destinations. No assumptions or policy recommendations are made; instead, the report strictly describes the observed data and visualisations provided by ACSAIR.
- Data notes
Frequency and Coverage: The data are monthly, spanning January 1998 to May 2025, which yields 329 observations, 27 full years plus 5 months of 2025. Every month in this range is represented with no gaps, providing a continuous time series of Kenya’s exports to the selected African markets.
Structure: Each record contains a Year, Month, and export values, in Ksh million, for each of the 11 destination categories, the ten named countries and the aggregated “Other” group. A Total column is included, representing the sum of all destination values for that month. All monetary figures are recorded in nominal Ksh million, not adjusted for inflation. For reference, “S. Africa” denotes South Africa, and DRC stands for the Democratic Republic of Congo.
Integrity: The Total exports value in each month is expected to equal the sum of the individual destination values. This holds true for all months apart from very minor rounding discrepancies: in about 204 out of 329 months, 62%, the provided total differs by only plus or minus 1 to 2 Ksh million from the sum of the parts. These tiny differences, well under 0.01% of the totals, likely result from rounding conventions and do not materially affect any analysis. Overall, the dataset appears internally consistent with complete coverage and accurate aggregation.
Totals and Sums: Across the entire period, 1998 to 2025, the sum of monthly Total exports is about 7,484,422 Ksh million, approximately Ksh 7.484 trillion. The ten specifically reported countries plus the “Other” category together account for all exports to Africa. Uganda is the single largest destination over the long run, as detailed later, reflecting its prominence among Kenya’s regional export markets.
- Overview of total exports
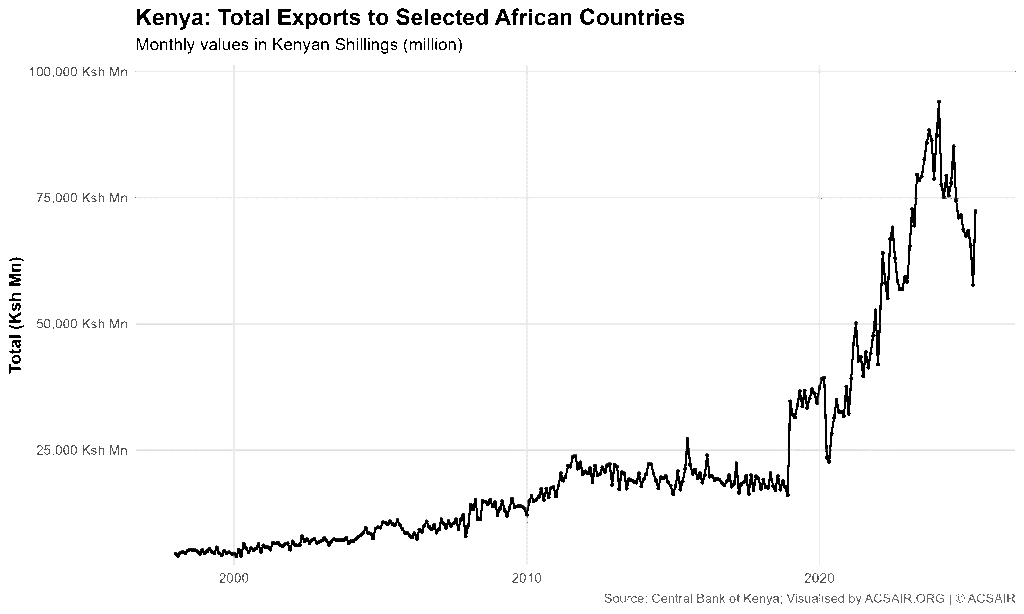
Figure 1: Kenya’s total monthly export value, Ksh million, to the selected African countries, January 1998 to May 2025.
This line chart shows the aggregate exports, sum of all destinations, over time. The trend is unmistakably upward: monthly export totals have increased dramatically from the late 1990s to the mid 2020s. In 1998, Kenya’s exports to these African partners typically ranged around 4,000 to 5,000 Ksh million per month. Thereafter, the total climbed in stages, reaching the tens of thousands of Ksh million by the 2010s and surging to record highs in the 2020s.
Over the 27 year span, total exports exhibit both growth and fluctuations. From 1998 through around 2010, the line rises gradually, indicating moderate growth, with seasonal oscillations creating a sawtooth pattern. A notable acceleration occurs in the late 2000s and mid 2010s, but the most dramatic change is around 2019: the total export value roughly doubles at the start of 2019, jumping from about 16,000 Ksh million in late 2018 to over 34,000 Ksh million by January 2019. After this structural jump, the aggregate trend continues upward at a high base. The series peaks in early 2024, when monthly exports hit an all-time high of 94,068 Ksh million in February 2024. This peak is roughly 20 times higher than the typical monthly totals in the late 1990s, illustrating the tremendous long-term growth. Seasonal patterns are still evident as smaller ripples on the rising curve, for example, we see periodic dips and spikes within each year, but the overall trajectory is dominated by growth.
The highest values occur in 2023 to 2024, and since that peak the total has eased slightly. By the first five months of 2025, exports moderated to around 57,675 to 72,337 Ksh million per month, with April 2025 being the lowest in that interval, at approximately 57.7 thousand Ksh million. These 2025 levels are lower than the late 2023 or early 2024 peak, but they remain historically high, far above the levels of even the early 2020s. Notably, the series experienced a sharp drop in mid 2020, reaching a local low of 22,625 Ksh million in May 2020, followed by a robust rebound. In summary, Figure 1 highlights a dramatic long-term expansion of Kenya’s exports to the region, punctuated by a few short-term downturns and accelerations. Exports grew from roughly 4 to 5 thousand Ksh million per month in 1998 to consistently above 50 to 80 thousand Ksh million per month by 2023 to 2025, reflecting both steady growth and a major upward regime shift starting in 2019.
- Composition by destination
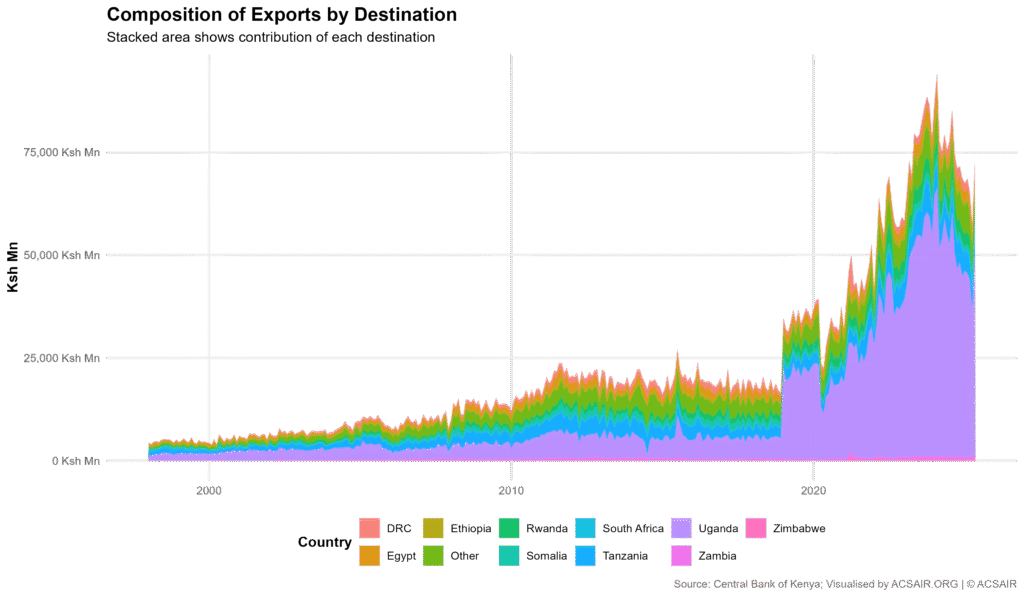
Figure 2: Composition of Kenya’s monthly exports by destination, 1998 to 2025.
This figure visualises how each of the 11 destination markets contributes to the total export value over time. The vertical thickness of each colored band represents the export value to that destination in a given month, and the sum of all bands, the top of the stacked area, corresponds to the total, as seen in Figure 1. This view reveals how the share and absolute contributions of each country have evolved.
In the late 1990s and early to mid 2000s, the stacked bands are relatively balanced, indicating that Kenya’s exports were spread across multiple countries. Uganda, one band in the chart, was already the single largest destination, but not overwhelmingly so, its band and that of Tanzania were of comparable magnitude at the start. For example, in 1998 Uganda and Tanzania each formed substantial portions of the total, while the “Other” category and several mid-tier countries, like Egypt and DRC, also occupied significant slices of the area. Through the 2000s, all bands grow somewhat thicker, signifying rising exports across the board, but no single country dominated the entire chart; the composition was diverse, with Uganda typically accounting for roughly one quarter to one third of the total, and Tanzania and the “Other” grouping also making sizeable contributions.
A striking shift in composition occurs around 2019, visible in Figure 2 as a sudden expansion of one band in particular, corresponding to Uganda. Starting in 2019, Uganda’s segment swells dramatically, becoming by far the largest component of the stacked area. In other words, exports to Uganda grew so much, both in absolute and relative terms, that Uganda went from being one important destination among several to dominating the export basket. By the 2020s, Uganda’s band occupies the majority of the area in most months, reflecting that roughly 60 to 70% of Kenya’s exports, by value, to these African partners were destined for Uganda. The “Other” category remains the second largest segment in recent years, but its band is much thinner in comparison, indicating that all other African markets combined make up a much smaller share than Uganda alone. Tanzania’s segment, which was once nearly as large as Uganda’s in the early 2000s, grows in absolute terms but is ultimately outpaced, its band contributes a modest portion of the total area by the 2020s.
Other countries’ bands in the stacked area chart show more gradual changes. For instance, Rwanda, Egypt, and DRC each maintain a visible presence throughout the period, with their areas gradually widening as exports to those countries increased over time, though they never approach the scale of Uganda’s band. Somalia and Ethiopia also broaden slightly in the 2020s, reflecting moderate growth. In contrast, South Africa and Zimbabwe remain consistently narrow ribbons along the bottom of the chart, underscoring that Kenya’s exports to these two countries have been very small in value relative to the others. Overall, Figure 2 illustrates not only the growth in total exports but also a dramatic change in export composition: the early years show a relatively heterogeneous distribution of export destinations, whereas the latest years are highly concentrated with Uganda accounting for the lion’s share of Kenya’s regional exports.
- Country-by-country time series
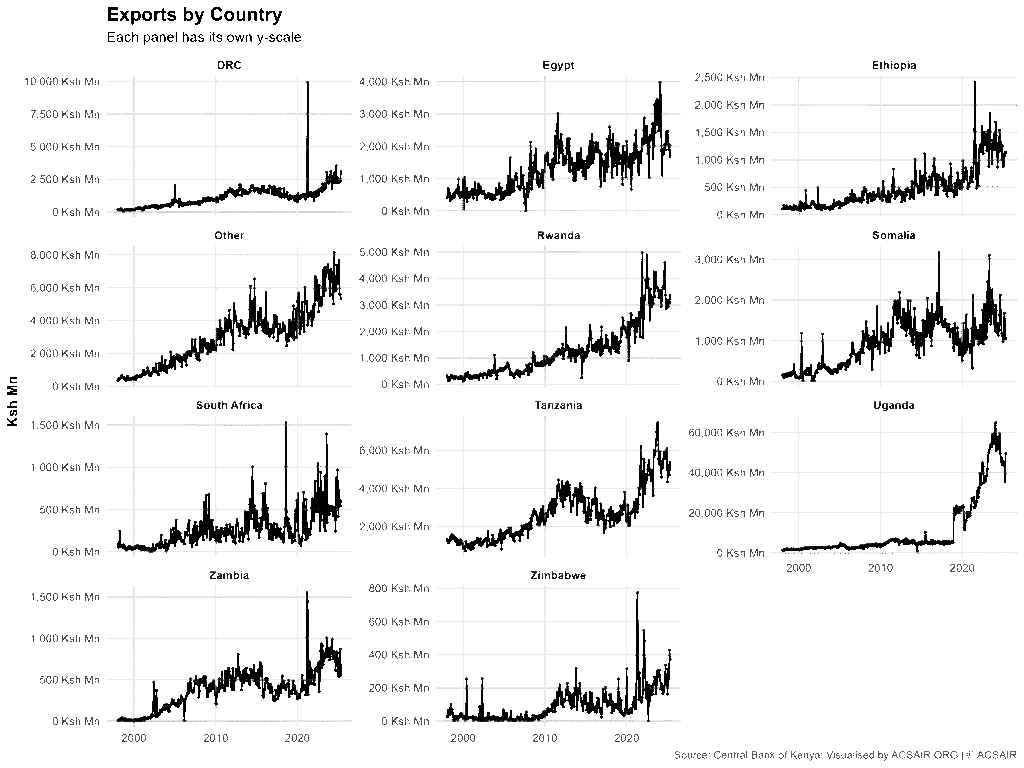
Figure 3: Individual time series of monthly export values to each destination.
Each panel isolates one destination, plotting Kenya’s exports to that country over time, with the same date axis from 1998 to 2025. Note that each panel has its own vertical scale, y-axis, tailored to that country’s export magnitudes, enabling us to see the patterns clearly for both large and small trade partners. Figure 3 allows a direct comparison of trends and variability between countries, revealing that each market has a distinct trajectory despite the overall growth trend.
Several destinations exhibit strong upward trends in exports, albeit with different timing. Uganda’s panel stands out most: it shows relatively modest exports in the late 1990s, on the order of a few thousand Ksh million per month, followed by a long-term rise. Notably, Uganda’s exports remained in the single-digit thousands, Ksh million, per month up until the mid 2010s, but around 2019 there is a dramatic inflection, the line for Uganda shoots upward, reflecting the massive surge also seen in the composition chart. By the 2020s, monthly exports to Uganda frequently exceed 50,000 to 60,000 Ksh million, with a peak above 65,000 Ksh million, in Feb 2024. The series for Uganda also shows seasonal volatility, regular peaks and troughs each year, and a brief downturn in 2020, but the overwhelming feature is the post 2019 jump and subsequent high plateau. The “Other” category, aggregated exports to all other African countries not individually listed, also has a generally rising curve. Its exports grow from low levels in the early 2000s to much higher values by the 2020s, for instance, the “Other” panel indicates monthly exports often in the 5,000 to 8,000 Ksh million range in recent years, up from just a few hundred or low thousands two decades prior. The “Other” series increases relatively steadily with some fluctuations and also shows elevated values around 2022 to 2023, reflecting broad growth in smaller African markets over that period. Tanzania, another major partner, exhibits a long-term upward trajectory as well: its panel shows exports rising from under 1,000 Ksh million per month in the late 1990s to peaks of around 7,000 to 8,000 Ksh million in the early 2020s. Tanzania’s growth, however, appears more gradual and cyclical. The line for Tanzania has some plateaus and dips, for example, there was a surge in the early 2010s, peaking around 2011 to 2012, a dip in the mid 2010s, then a strong rise again in the late 2010s into the 2020s. By 2023, exports to Tanzania hit record highs, the series peaks near 7,489 Ksh million in Nov 2023, before a slight pullback. In summary, Uganda, “Other,” and Tanzania all show increasing trends, but Uganda’s increase is by far the steepest in magnitude, especially after 2019, whereas Tanzania and the collective “Other” markets grew more moderately.
Looking at the other panels in Figure 3, we see more varied patterns. Several medium-sized destinations have grown substantially but not without interruptions. Rwanda’s export series, for example, trends upward across the entire period, rising from just a few hundred Ksh million per month in the late 1990s to around 3,000 to 4,000 Ksh million by the early 2020s at its peaks. Rwanda’s growth was steady, with notable acceleration after 2018; its monthly exports reached highs just under 5,000 Ksh million in recent years. Egypt shows a somewhat volatile but upward sloping line: in the 2000s, exports to Egypt fluctuated and even hit zero in one month, indicating at least one month with no recorded exports, e.g. September 2007 saw 0 Ksh million, but overall the trend climbed. By the 2020s, Egypt’s exports often range around 1,000 to 2,500 Ksh million per month, with a peak near 3,985 Ksh million, Feb 2024. DRC, Congo, has a long-term rise that includes a mid-period dip, exports to DRC grew through the 2000s and early 2010s, reaching a high around 2014, then fell back in the late 2010s. In the 2020s, the DRC line recovers and exceeds past levels, with exports rising above 2,000 Ksh million per month and hitting new highs by 2024, monthly values over 3,000 Ksh million at peak. Somalia’s panel reveals a fluctuating pattern: exports increased in the early 2000s, spiked around 2011 to 2012, over 1,500 Ksh million in some months, then declined later in that decade. After 2018, Somalia’s exports trend upward again, reaching their highest monthly values in the early 2020s, the series peaks above 2,100 Ksh million in one of the 2023 months. The volatility in Somalia’s series, sharp ups and downs year to year, stands out compared to more consistently rising lines like Rwanda’s or Ethiopia’s.
The smallest export destinations in absolute terms, Ethiopia, South Africa, Zambia, and Zimbabwe, each have much lower magnitudes and relatively flat profiles, though there are some growth trends. Ethiopia’s exports start from very low levels, tens of millions of Ksh in the late 1990s, and grow gradually, especially after 2015. By the mid 2020s, exports to Ethiopia often fall in the few hundred Ksh million per month range, peaking around 2,400 Ksh million at one point, indicating a notable increase but still a small fraction of Kenya’s total exports. Zambia shows a similar pattern of modest scale and growth: aside from occasional spikes, exports to Zambia generally remained below 500 Ksh million per month until the late 2010s. They rose in the early 2020s, with some months exceeding 800 to 900 Ksh million and a record high around 1,555 Ksh million, but overall Zambia’s panel stays near the bottom of the scale. South Africa stands out as a large economy but a minor destination for Kenyan exports in this dataset, its series is flat and very low. From 1998 through the 2010s, monthly exports to South Africa were often only a few dozen to a few hundred Ksh million, with a slight uptick around 2014, one monthly spike above 1,500 Ksh million in August 2018 was unusual. Even by 2025, typical exports to South Africa remain only a couple of hundred Ksh million per month, making it one of the smallest bars in the composition. Zimbabwe is the smallest of all: its time series is essentially zero or near zero for much of the early period, some months literally recorded 0 Ksh million exported. It rose modestly in the early 2010s, peaking around 700 to 800 Ksh million in one exceptional month, but then fell and flatlined at very low levels, often below 100 Ksh million per month in the late 2010s. A bump in 2021 is visible, exports to Zimbabwe jumped that year, with monthly values reaching a few hundred Ksh million, but the series remains tiny relative to others. These individual panels underscore that Kenya’s export growth has been uneven across partners: Uganda’s and a few others’ exports exploded, some countries saw moderate steady growth, and a few markets stayed negligible. Each country’s chart also displays its own seasonal volatility and any unique historical fluctuations, for instance, the dips in DRC and Somalia during the late 2010s, or Zimbabwe’s brief early 2010s rise and subsequent collapse, adding nuance to the aggregate story.
- Seasonality patterns
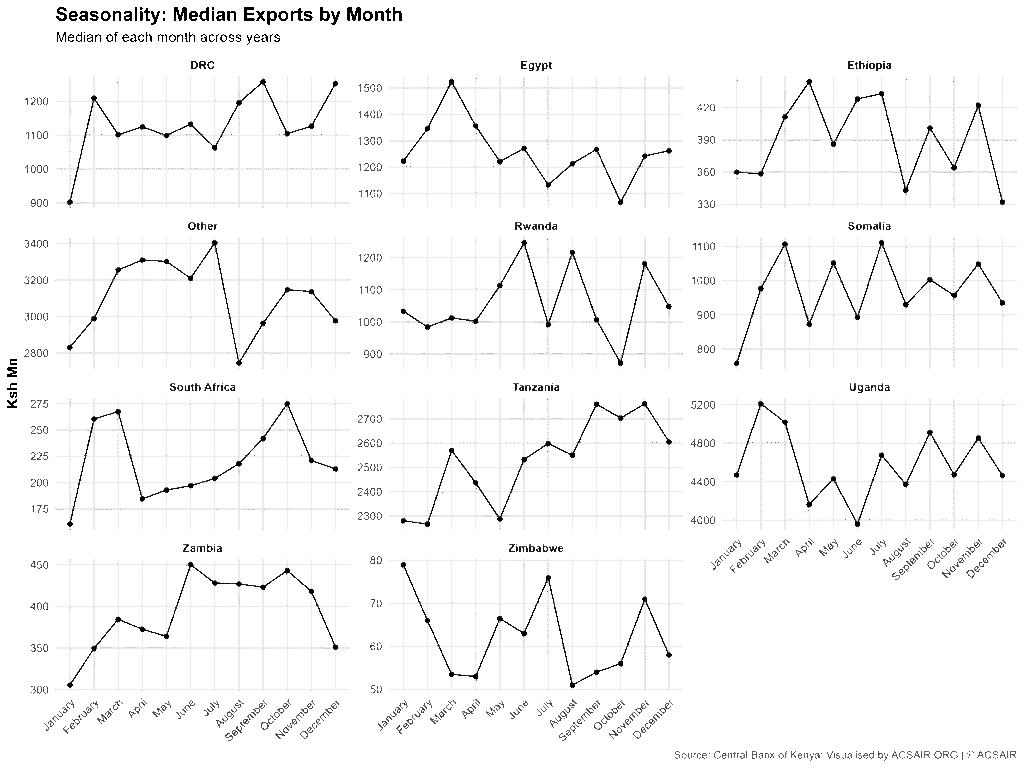
Figure 4: Seasonality of exports by destination, expressed as the median value for each calendar month over the period.
Each panel in Figure 4 condenses the monthly data into a typical seasonal profile for one destination, plotting January through December on the x-axis and the median export value for that month, computed across all years 1998 to 2025, on the y-axis. Using medians, rather than means, helps to mitigate the influence of extreme outlier months, providing a robust sense of the usual seasonal highs and lows. The seasonal patterns differ notably between countries, indicating that the timing of export surges or slowdowns within a year is not uniform across all markets.
Several countries exhibit peak exports early in the calendar year. For instance, Uganda, Kenya’s largest market, tends to experience its highest export values around February, with a median of about 5,210 Ksh million, and then slightly lower medians in the middle of the year, around June, median approximately 3,960 Ksh million. This suggests Kenya’s exports to Uganda are typically strongest in the late boreal winter, February, and relatively softer in mid year, before perhaps rising again toward year end. Similarly, Zimbabwe shows its highest typical value in January, median approximately 79 Ksh million, and the lowest around August, about 51 Ksh million, indicating that exports to Zimbabwe, though very small, are seasonally higher in the first month of the year. In contrast, a number of other destinations see seasonal peaks toward the latter part of the year. Tanzania’s median exports gradually increase as the year progresses, reaching a plateau in September to November, medians around 2,700 to 2,760 Ksh million, the highest being November. This implies a tendency for exports to Tanzania to ramp up through the year and climax in the early part of the fourth quarter. South Africa also follows a late year peak pattern: its median rises from only about 160 Ksh million in January to a high of about 275 Ksh million in October, suggesting exports to South Africa are typically lowest at the start of the year and peak in the middle of the southern hemisphere spring. The DRC shows a pronounced rise into the third quarter, median exports to DRC increase from about 902 Ksh million in January to a maximum around 1,258 Ksh million in September, before easing slightly toward December. These patterns for Tanzania, South Africa, and DRC reflect markets where Kenyan exports generally build up over the course of the year and culminate in late Q3 or Q4.
Other destinations have mid year or unique seasonal peaks. Rwanda’s median exports peak in June, approximately 1,246 Ksh million, indicating a mid year high, and remain relatively elevated through July, then dip toward October to November. The aggregated “Other” category also shows its highest typical value in July, about 3,405 Ksh million, suggesting that collectively, the smaller African markets import more from Kenya around mid year on average. Somalia sees its median exports crest in July as well, about 1,111 Ksh million, with lower values in the beginning of the year, median approximately 758 Ksh million in January, implying a seasonal rise into mid year for Somalia. Zambia’s seasonal pattern is notable in mid year too: its median exports are highest in June, about 450 Ksh million, and generally lower at the very beginning, for example, about 306 Ksh million in January, and end of the year. Meanwhile, Egypt stands out with a peak in March, about 1,524 Ksh million, earlier than most others, and a trough around October, about 1,068 Ksh million. Ethiopia has a relatively flat seasonal curve with a slight peak in April, median approximately 444 Ksh million, and a low in December, about 332 Ksh million, indicating less pronounced seasonality but a tendency for spring months to be a bit higher. In summary, Figure 4 reveals that seasonality varies by market: some countries, like Uganda and Zimbabwe, tend to peak in the first quarter, many, Rwanda, Somalia, “Other,” Zambia, in the middle of the year, and others, Tanzania, DRC, South Africa, in the third to fourth quarter, while a few, Egypt, peak in early spring. These differences highlight that Kenya’s export flows are influenced by seasonal demand and supply factors that are unique to each destination country or region, such as harvest periods, holiday seasons, or economic cycles in those countries. Despite the differing seasonal timing, one commonality is that nearly all destinations show some degree of intra-year fluctuation, rather than having perfectly flat exports throughout the year, underscoring the importance of seasonality in trade planning.
- Recent five-year trend
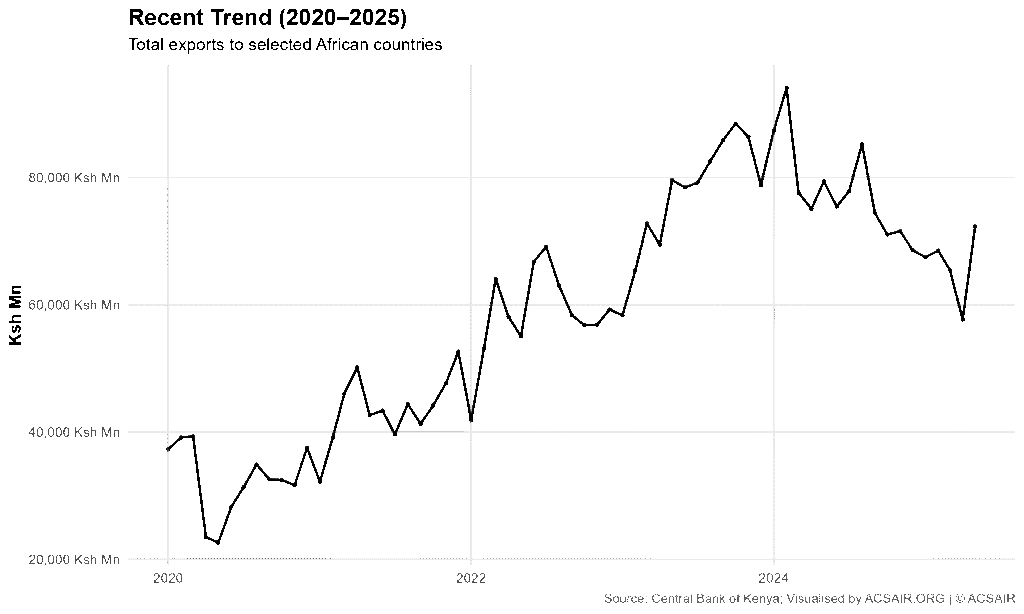
Figure 5: Kenya’s total exports to the selected African countries, zoomed in on the last five years, January 2020 to May 2025.
This line chart is essentially a magnified view of the tail end of Figure 1, highlighting short-term fluctuations and the dramatic changes that occurred in the early 2020s. Over this five-year horizon, we see significant volatility superimposed on an overall rising trend.
The period begins with a sharp downturn in 2020. In the first half of 2020, total exports plunged to their five-year low in May 2020 at approximately 22,625 Ksh million. This was a notable dip, visible as a trough in the figure, and represents the weakest monthly export performance in recent memory. However, the decline was short-lived: by the second half of 2020, the export totals were recovering, and the line in Figure 5 ascends rapidly through 2021 and 2022. The rebound turned into an exceptional boom, the total exports more than quadrupled from the 2020 low to the subsequent peak. The chart shows a particularly steep climb during 2021 and 2022, with only mild seasonal oscillations interrupting the upward momentum. By early 2023, monthly totals had doubled relative to 2020 levels, and they kept rising.
The all-time high is clearly seen in early 2024 on this zoomed chart: the line reaches its apex at 94,068 Ksh million in February 2024, marked by the highest point on the figure. This peak was the culmination of the post 2020 surge, representing an extraordinary level of exports for Kenya, over 4.1 times the May 2020 value in the span of less than four years. After February 2024, the trend shows a reversal, exports began to ease off from their peak. The line slopes downward through mid 2024, indicating a cooling off. By late 2024, monthly totals had fallen into the 68,000 to 78,000 Ksh million range, for example, December 2024 was around 68,582 Ksh million. This downward drift continued into the first part of 2025. The figure captures a dip in early 2025, with April 2025 reaching about 57,675 Ksh million, the lowest point since the 2020 surge, though still much higher than anything prior to 2020. In May 2025, the latest data point, the exports tick up again to roughly 72,337 Ksh million, suggesting a partial rebound after the early 2025 softening.
Overall, the last five years have been a period of unprecedented volatility and growth. The exports went from a pandemic-era trough in 2020 to successive record highs by 2023 to 2024, and then into a moderate correction phase by 2025. Figure 5 underscores how unusual the early 2020s were: the amplitude of change, from approximately 22.6k to about 94k and back to roughly 57k Ksh million, far exceeds typical year-to-year changes observed previously. Despite the recent pullback from the peak, the May 2025 export level remains roughly three times the monthly values seen five years earlier in early 2020. This suggests that the structural increase in Kenya’s regional export volume, particularly the jump associated with 2019 to 2021, has largely been maintained, even after some cooling. The recent trend therefore highlights both the resilience and the new scale of Kenya’s exports to Africa in the wake of the early 2020s economic upheavals.
- Top destinations in Jan to May 2025
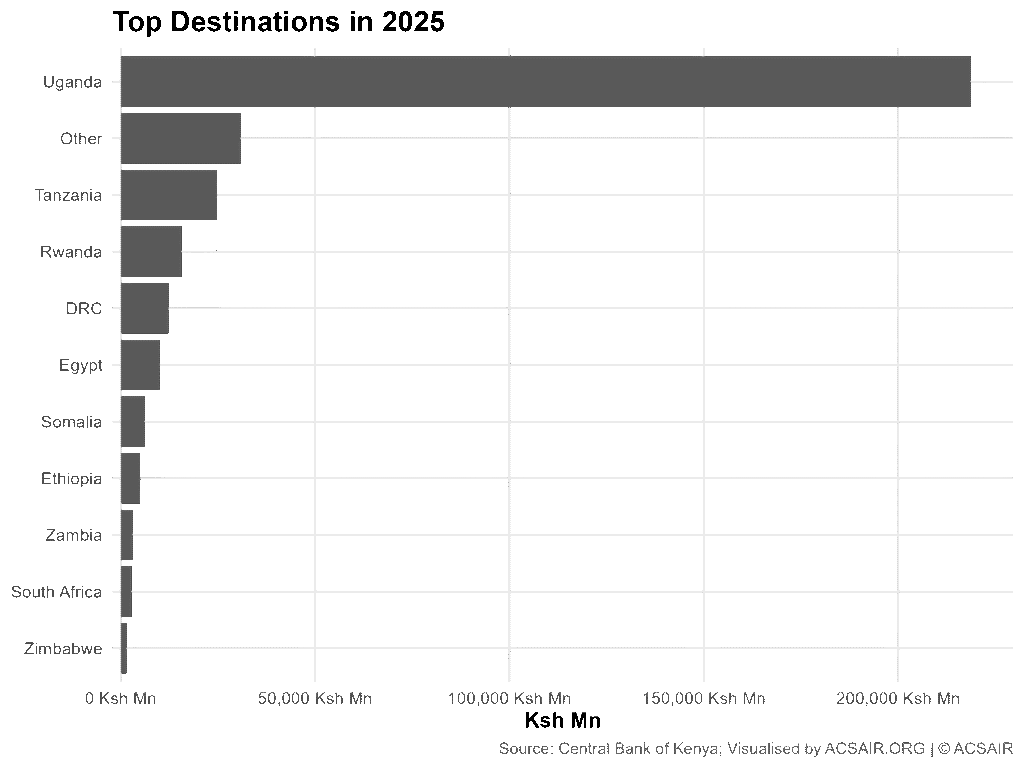
Figure 6: Ranking of Kenya’s export destinations by total value for the latest year-to-date period, January to May 2025.
This figure presents a horizontal bar chart where each bar represents the sum of exports, Ksh million, to a given country, or category in the case of “Other,” for the first five months of 2025. The bars are ordered from largest to smallest, providing a clear ranking of the export market importance in the most recent data. The numeric totals from January to May 2025 are as follows:
Uganda – 218,681 Ksh million
Other, aggregate of all other African countries not listed – 30,883 Ksh million
Tanzania – 24,813 Ksh million
Rwanda – 15,708 Ksh million
DRC, Congo – 12,367 Ksh million
Egypt – 10,135 Ksh million
Somalia – 6,241 Ksh million
Ethiopia – 5,098 Ksh million
Zambia – 3,165 Ksh million
South Africa – 2,844 Ksh million
Zimbabwe – 1,526 Ksh million
The ranking makes clear that Uganda is overwhelmingly the top destination for Kenya’s exports in the current period. Kenya exported roughly 218.7 thousand Ksh million to Uganda in just five months, which is about 66% of all exports to the listed African markets for January to May 2025. In fact, Uganda’s bar is longer than the next eight destinations combined. The second position is the “Other” category, totaling approximately 30.9 thousand Ksh million, which aggregates many smaller trading partners. Even so, Uganda’s exports are about seven times the exports to “Other,” underlining Uganda’s singular importance. Tanzania ranks third at approximately 24.8 thousand Ksh million, making it the largest individual country destination after Uganda. However, Uganda’s exports are nearly nine times those to Tanzania, an enormous gap. Following Tanzania, we see a drop to the mid tier partners: Rwanda, fourth, and DRC, fifth, received roughly 15.7k and 12.4k Ksh million respectively in the five-month span. Egypt is close behind in sixth with 10.1k, meaning there are five destinations, besides Uganda, that each accrued on the order of 10 to 25 thousand Ksh million in Kenyan exports in early 2025.
After Egypt, there is another step down to the smaller destinations: Somalia, seventh, at 6.2k, Ethiopia, eighth, at 5.1k, and Zambia, ninth, at 3.2k Ksh million. These values indicate relatively modest trade volumes compared to the top tier. Finally, at the bottom of the ranking, South Africa, tenth, and Zimbabwe, eleventh, received the least, only 2.8k and 1.5k Ksh million respectively in January to May 2025. These two markets are outliers on the low end, each accounting for under 1% of the total exports in this period. In summary, the latest data underscore a highly skewed distribution: Kenya’s export earnings from Africa in 2025 are dominated by Uganda, with a handful of other neighbors, Tanzania, Rwanda, DRC, Egypt, constituting a secondary tier, and the rest making up a very small fraction. This ranking is consistent with the trends observed in earlier sections, particularly the composition analysis in Figure 2, confirming that Uganda is the principal driver of Kenya’s regional export growth, while other markets, though growing, remain much smaller by comparison.
- Summary comparison of views
Synthesizing all the above perspectives, a clear narrative emerges about Kenya’s export performance within Africa over the past quarter century. First, the overall trend, Figure 1, is one of robust growth: total monthly exports increased roughly 16 to 20 fold from the late 1990s to the mid 2020s, highlighting a remarkable expansion of Kenya’s regional trade. This growth was not completely steady, it featured periods of acceleration, most dramatically around 2019, and temporary setbacks, notably the dip in 2020, but the long-term trajectory has been strongly upward, reaching peak export values in 2023 to 2024 at levels never seen before.
Secondly, the composition of exports by destination has shifted profoundly. In the early years, Kenya’s exports were distributed among many countries, Uganda, Tanzania, and others each taking sizable shares, whereas in recent years Uganda has become disproportionately dominant. As shown in Figure 2 and confirmed by the latest rankings, Figure 6, Uganda now accounts for roughly two thirds of the total, a stark change from the roughly one quarter share it held two decades ago. This indicates an increasing concentration of Kenya’s African export portfolio. Tanzania and the collective “Other” countries remain important but are distant followers, while markets like Rwanda, DRC, and Egypt form a middle tier of growing significance. Smaller partners such as South Africa and Zimbabwe have consistently low contributions. Together, the composition and ranking views underscore how Kenya’s export growth has been led by a few key destinations, primarily Uganda, even as absolute exports to all partners have generally risen.
Thirdly, each destination has its own story over time, as Figure 3’s individual panels demonstrated. Some countries, like Rwanda, Ethiopia, and Egypt, show relatively steady, incremental growth in imports from Kenya, whereas others have experienced volatile or multi-phase trajectories. For example, Tanzania and Somalia saw surges in the early 2010s, lulls in the late 2010s, then renewed growth, highlighting that bilateral trade can be cyclical or impacted by episodic factors. DRC had a mid period decline before recovering to new highs. These idiosyncratic paths mean that while the aggregate export trend was up, the underlying dynamics varied greatly by country. The small countries’ series illustrate that not all markets have expanded, South Africa and Zimbabwe remained flat or negligible for long periods, acting almost as a constant baseline. Thus, the country-by-country view adds depth, revealing heterogeneity beneath the aggregate growth.
Moreover, the seasonal analysis, Figure 4, provided a cross-sectional insight that complements the time trends. It showed that Kenya’s export flows are subject to seasonal forces, however, those forces manifest differently across markets. This comparison highlighted, for instance, that exporting to Uganda and Zimbabwe tends to spike early in the year, whereas exports to Tanzania and DRC peak later in the year. Recognizing these seasonal patterns alongside the trends is important: it means Kenya’s exporters likely face different seasonal demand cycles in each country. When planning and evaluating performance, one must consider that a “low” month for one destination, e.g. Uganda in mid year, might coincide with a “high” month for another, e.g. DRC in September. The seasonal view, therefore, enriches the analysis by explaining some of the short-term fluctuations observed in Figures 1 and 3 as regular seasonal variance rather than anomalies.
Finally, the recent period, 2020 to 2025, encapsulates many of these elements in sharp relief: an initial shock and rapid recovery, overall trend, a sustained dominance of Uganda, composition, and potential seasonal swings, the slight 2025 uptick after an April low. The record highs achieved and subsequent partial correction illustrate the system’s volatility and growth capacity. All views combined indicate that as of 2025, Kenya’s export engagement with Africa is at its historically highest level, but also more concentrated and possibly more seasonally differentiated than in the past. In summary, the multi-faceted analysis confirms: a long-run exponential growth in export volumes, a narrowing focus onto one primary market, with associated risks and benefits, and diverse, country-specific patterns beneath the surface, including distinct seasonal rhythms and intermittent cycles. These insights collectively provide a thorough understanding of the dataset and the story it tells about Kenya’s intra-African export performance.
Appendix: Key aggregates and reference data
Date range and observations:
Monthly data from January 1998 through May 2025, inclusive. This yields 329 months of continuous observations. The dataset covers 27 full calendar years plus 5 months of 2025. There are no missing months in the series.
Total export sums:
Over this entire period, Kenya’s exports to the selected African countries sum to 7,484,422 Ksh million. For context, in the first year, 1998, the total annual exports were 57,287 Ksh million, whereas in 2024, the last full year, the annual total was 937,531 Ksh million, more than 16 times the 1998 level, reflecting the long-term growth trend documented in the report. The average monthly export over 1998 to 2025 is approximately 22,750 Ksh million, though this average masks the large increase over time and the high variability.
Cumulative shares by destination:
Across the Jan 1998 to May 2025 period, Uganda is the largest destination by far in cumulative terms, accounting for roughly 3,666,126 Ksh million of exports, which is about 49% of the total exports to all these destinations. The next largest category in aggregate is “Other,” with approximately 994,257 Ksh million, around 13% of the total. Tanzania is close behind the Other group with about 876,574 Ksh million, 12%. Together, these top three, Uganda, Other, Tanzania, constitute roughly 74% of all the exports recorded in the dataset. The remaining seven specific destinations collectively make up the remaining approximately 26% of the total. Among them, Egypt, 432,299 Ksh million, about 5.8%, and Rwanda, 422,077 Ksh million, about 5.6%, are the most significant over the long run, each about 5 to 6% of the cumulative total. DRC follows with 378,523, 5.1%, and Somalia at 309,497, 4.1%. Ethiopia, 162,044 Ksh million, 2.2%, Zambia, 125,909, 1.7%, and South Africa, 86,328, 1.2%, each contributed only a small fraction of the multi-decade total. Zimbabwe, at 30,784 Ksh million, accounts for a mere 0.4% of the overall exports, the smallest share among the categories. These figures affirm that Uganda’s dominance is not just a recent occurrence but also evident in the cumulative totals, albeit amplified in recent years, and that a few markets drive the bulk of the exports while several others remain marginal in the grand sum.
Data consistency:
The provided Total column was verified against the sum of individual destinations for each month. They align almost perfectly, with only trivial rounding differences in some months, plus or minus 1 to 2 Ksh million as noted in Data Notes. Thus, the key aggregates computed, annual totals, period totals, etc., from the destination data are reliable and consistent with the reported totals. All values are nominal and reported in Ksh million. No inflation adjustments or currency conversions have been applied, and no missing data points were present, ensuring that the aggregates accurately reflect the sum of monthly current-price values over time.
Reference for figures: All charts, Figures 1 to 6, were produced by Afrique Center for Statistics, Artificial Intelligence & Innovation Research (ACSAIR) based on the dataset from the Central Bank of Kenya as described. Figure 1 shows the total exports over time; Figure 2 the stacked composition by country; Figure 3 the individual country time-series panels; Figure 4 the median seasonal profile for each country; Figure 5 the zoomed recent trend; and Figure 6 the ranking for January to May 2025.