

Purpose and Scope
This report presents a comprehensive analysis of Kenya’s annual Gross Domestic Product (GDP) from 2000 through 2024. Prepared by the Afrique Center for Statistics, Artificial Intelligence & Innovation Research (ACSAIR), it examines GDP trends in nominal terms, current prices, and real terms, constant prices, alongside annual real growth rates and inflation as measured by the GDP deflator. The objective is to offer clear, factual insights into the size and growth of Kenya’s economy over 25 years, highlighting differences between nominal and real GDP. All figures are in Kenyan shillings, Ksh, and the analysis is intended for policymakers, researchers, and stakeholders seeking a concise, data-driven view of Kenya’s economic trajectory.
Data Preparation
The dataset covers Kenya’s annual GDP values from 2000 to 2024, reported in millions of Kenyan shillings, Ksh. Nominal GDP, GDP at current market prices, is given in nominal Ksh millions for each year, reflecting the actual market value of all goods and services produced. Real GDP is provided in constant 2016 prices, Ksh millions, which adjusts for inflation and expresses output at the 2016 price level. Using 2016 as the base year, 2016 = 100, allows comparisons of economic output over time without price distortions. The annual GDP growth rate, percent, corresponds to year-over-year growth in real GDP, that is, the percentage change in real GDP from the previous year, which measures volume growth.
To analyze price level changes, a GDP deflator index was derived as nominal GDP divided by real GDP, multiplied by 100. This index reflects the aggregate price level relative to 2016. In 2016, the deflator is 100 by definition, since nominal and real GDP are equal in the base year. Kenya’s national accounts underwent base-year revisions during this period, notably in 2009 and 2016, introducing level shifts in the real GDP series. The data here align real GDP to the 2016 base; earlier years include rebased estimates, creating a discontinuity around 2009, when the base year was updated. All comparisons and growth calculations use the data as provided. Values are rounded to the nearest million Ksh, or converted to trillions of Ksh for readability, and percentages are rounded to one decimal place where appropriate.
Nominal vs Real GDP Levels, 2000 to 2024
Kenya’s GDP grew substantially between 2000 and 2024 in both nominal and real terms. Nominal GDP measures the economy’s size in current prices, while real GDP measures it in constant 2016 prices, removing inflation. Comparing the two reveals the impact of price changes over time. Figure 1 below shows the trajectories of nominal and real GDP over the 25-year period.
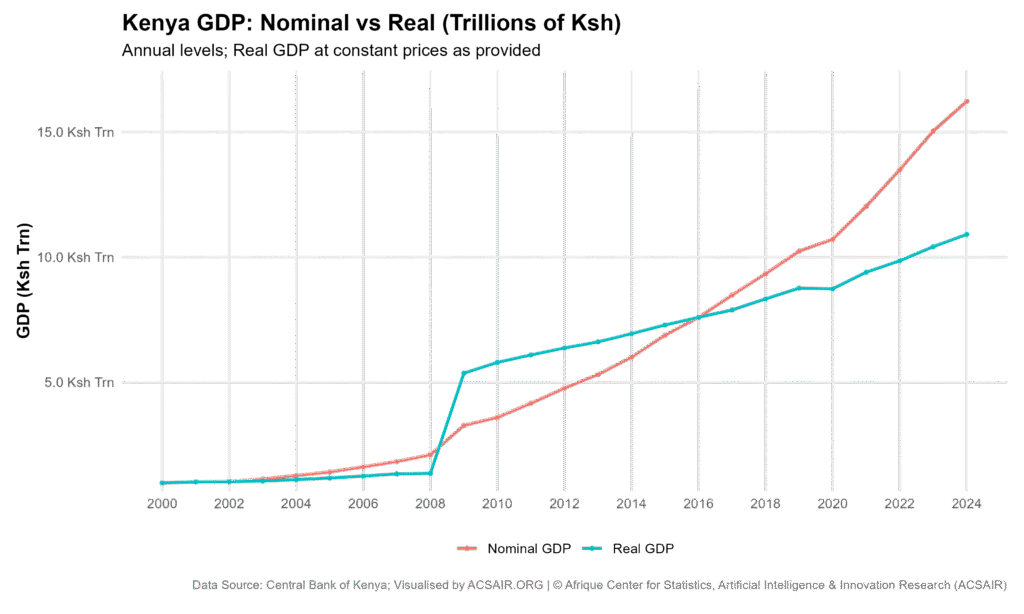
Figure 1: Annual nominal GDP versus real GDP for Kenya from 2000 to 2024.
Nominal GDP, blue line, is measured in current Ksh, and real GDP, orange line, is measured in 2016 Ksh, constant prices. Both are plotted in trillions of Ksh. Both nominal and real GDP display strong upward trends, but nominal GDP rises much more steeply because of compounding inflation. In 2000, nominal GDP was approximately Ksh 0.97 trillion, while real GDP, in 2016 prices, was about Ksh 0.98 trillion. These figures were nearly the same at the start, indicating that the general price level in 2000 was slightly lower than in 2016, nominal GDP in 2000 was about 98 percent of the real GDP value for that year. By 2024, nominal GDP had reached about Ksh 16.22 trillion, compared to real GDP of roughly Ksh 10.91 trillion in 2016 prices. This widening gap reflects cumulative inflation over two and a half decades. The nominal and real GDP lines intersect in 2016, the base year where nominal GDP equals real GDP by definition. After 2016, nominal GDP continues to outpace real GDP. By 2024, nominal GDP is about 49 percent higher than real GDP for the same year, underscoring a significant rise in the overall price level since 2016. Due to statistical revisions, rebasing of GDP in 2009, the relative positions of the nominal and real GDP lines change around that point, a technical discontinuity rather than an economic contraction. Overall, Figure 1 shows that Kenya’s economy expanded dramatically in absolute terms from 2000 to 2024, and that a considerable share of the increase in nominal GDP is attributable to inflation, especially over the long run.
Annual GDP Growth Rate, Real, Percent
In real terms, Kenya’s economy generally posted positive growth each year, with only one recent downturn. Figure 2 presents annual GDP growth rates, year-over-year percent change in real GDP, from 2000 through 2024, illustrating cyclical performance and volatility.
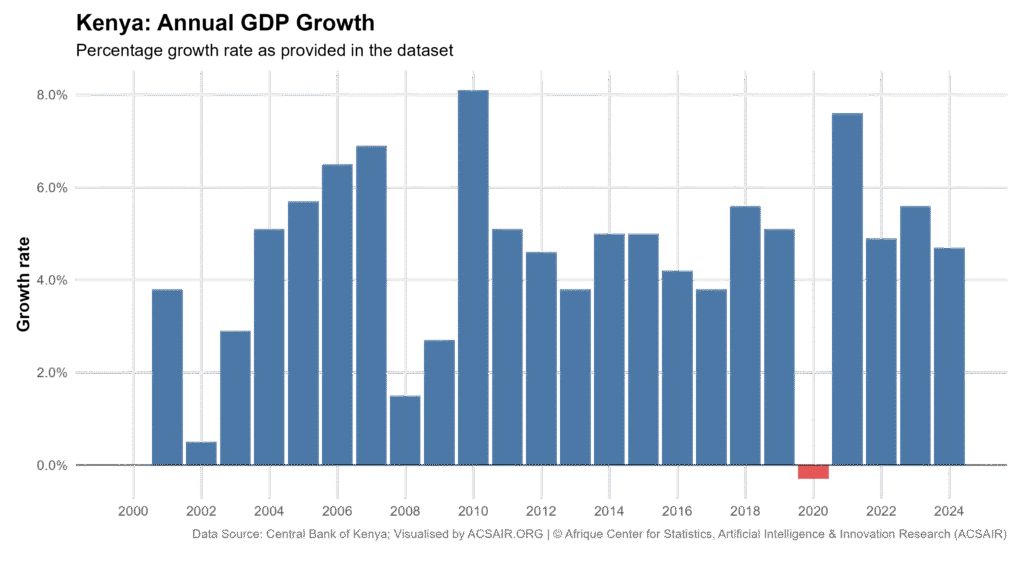
Figure 2: Annual real GDP growth rates, percent, for Kenya, 2000 to 2024.
Each bar represents the percentage growth in real GDP, constant 2016 prices, compared to the previous year. Positive growth rates are shown in blue, and the single year of contraction is shown in red. Kenya’s real GDP growth was positive in 24 out of 25 years. Growth was modest in the early 2000s, for example, 0.0 percent in 2000, essentially no growth, and 0.5 percent in 2002, reflecting stagnation. The mid-2000s brought improvement, with growth of around 5 to 7 percent per year, for example, 5.1 percent in 2004, 5.7 percent in 2005, 6.5 percent in 2006, and 6.9 percent in 2007, indicative of robust expansion. A notable dip occurred in 2008, when growth fell to 1.5 percent, coinciding with domestic challenges. In 2009, growth recovered modestly to 2.7 percent.
Kenya’s highest growth within 2000 to 2024 was 8.1 percent in 2010, a peak attributed to recovery momentum after the 2008 to 2009 slowdown. Through the 2010s, growth stabilized in a moderate range, for example, 5.1 percent in 2011, 4.6 percent in 2012, 3.8 percent in 2013, and around 5.0 percent in 2014 and 2015. The only contraction in this 25-year span occurred in 2020, when real GDP shrank by 0.3 percent, red bar, reflecting an extraordinary shock that year. This was an outlier in an otherwise consistently growing trend. The economy rebounded strongly in 2021 with 7.6 percent growth, then settled to 4.9 percent in 2022, 5.6 percent in 2023, and an estimated 4.7 percent in 2024. Overall, Kenya’s real GDP growth averaged roughly 4.5 percent per year over 2000 to 2024, indicating steady expansion. Most years, about two thirds of the time, saw growth in the 3 to 6 percent range, underscoring relative stability. The data highlight both resilience, with only one year of contraction, and variability, with growth swinging from near zero to above 7 percent.
GDP Deflator Index, Inflation Indicator
The GDP deflator index captures changes in the general price level of all goods and services produced, measuring economy-wide inflation over time. It is calculated as nominal GDP divided by real GDP, multiplied by 100, with 2016 set to 100. Figure 3 shows the GDP deflator index for Kenya from 2000 to 2024, reflecting how prices have moved relative to 2016.
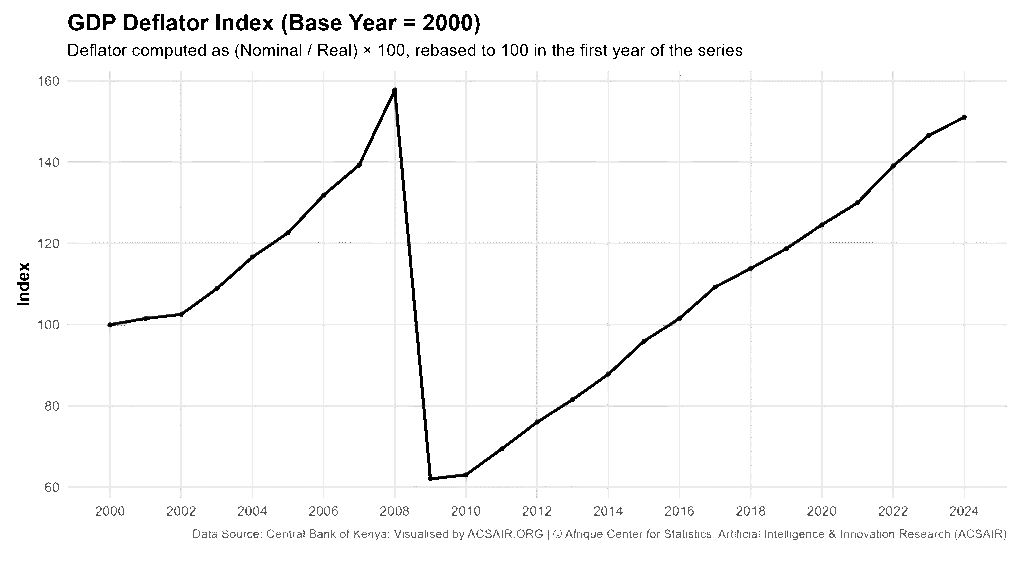
Figure 3: GDP deflator index for Kenya, 2000 to 2024, 2016 = 100.
This index measures the aggregate price level each year relative to 2016. Values above 100 indicate prices higher than in 2016; values below 100 indicate prices lower than in 2016. There is a visible discontinuity between 2008 and 2009, the line is broken at that point, due to a change in GDP base year methodology in 2009. Before that break, the index, based on an older base, rose from approximately 98 in 2000 to about 155 in 2008, suggesting that by 2008 overall prices, as captured by the GDP basket, were roughly 55 percent higher than the 2016 price level. In 2009, after statistical rebasing, the deflator index resets to around 61. This lower value does not imply sudden deflation; it reflects the new base year and revised real GDP estimates, which recalibrated the index. From 2009 onward, the deflator climbs steadily with no further breaks.
By 2016, the index is exactly 100, since 2016 is the base year. After 2016, it continues to rise, reaching approximately 149 in 2024. An index of 149 means that the 2024 GDP price level is about 49 percent higher than in 2016. In practical terms, if a bundle of goods and services produced in 2016 cost Ksh 100, that same bundle would cost about Ksh 149 in 2024. The increase from 100 in 2016 to 149 in 2024 indicates sustained inflation over the last eight years, averaging roughly 5 to 6 percent per year in GDP-weighted terms. Over the longer span, the deflator rose from the low 60s in 2009, immediately after rebasing, to 149 in 2024, more than doubling in 15 years. This signals significant cumulative inflation from 2009 to 2024. The apparent drop between 2008 and 2009 reflects methodology changes, not a real decrease in prices. When interpreting the deflator, compare values within a consistent base period. Within each continuous segment, the trend is upward. Kenya’s GDP deflator shows overall inflationary growth in every subperiod, reflecting rising price levels alongside real growth.
Latest Year Comparison: Nominal vs Real GDP in 2024
A direct comparison for 2024 highlights the impact of price changes since the base year. Figure 4 provides a side-by-side view of nominal GDP versus real GDP for 2024.
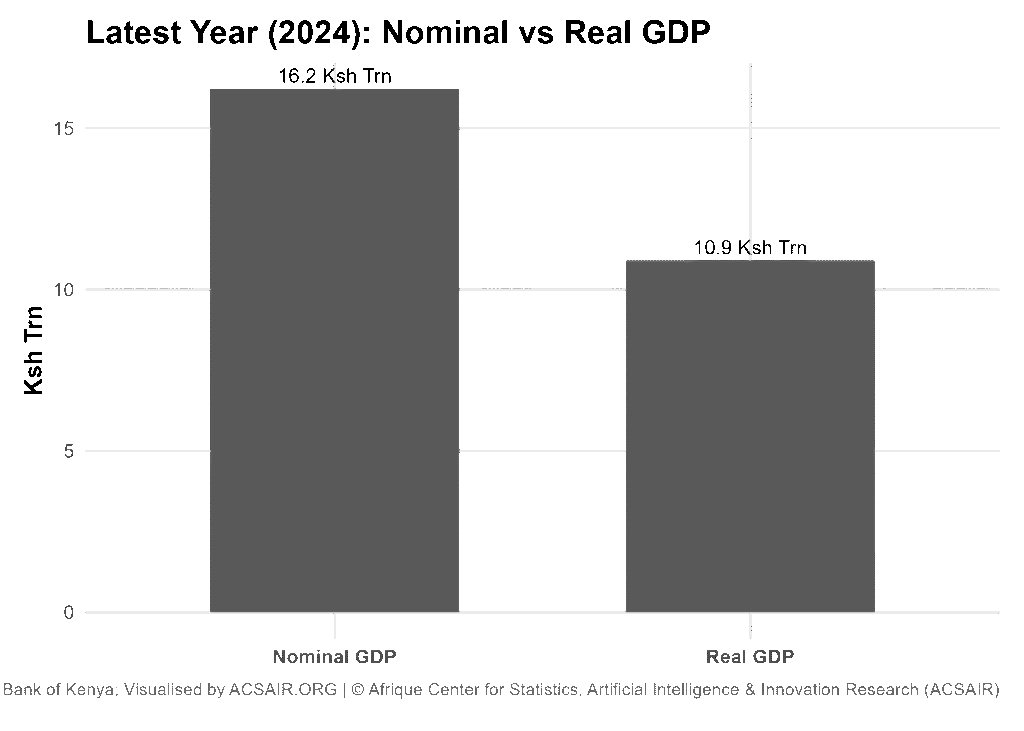
Figure 4: Nominal GDP vs Real GDP in 2024, in trillions of Ksh.
The left bar, blue, represents nominal GDP in 2024, and the right bar, orange, represents real GDP in 2024, measured in 2016 prices. Nominal GDP in 2024 was Ksh 16.224 trillion, while real GDP was Ksh 10.908 trillion, in 2016 value terms. The nominal figure is significantly higher, by approximately Ksh 5.3 trillion, reflecting price inflation since 2016. Valued at 2016 prices, 2024 output would total about Ksh 10.91 trillion; valued at 2024 current prices, the same output is worth Ksh 16.22 trillion. This roughly 49 percent difference corresponds to the 2024 GDP deflator, about 149, discussed earlier. It shows that nearly one third of the 2024 nominal GDP value is attributable to accumulated price increases since 2016, while the remainder reflects real growth in output. This comparison helps clarify inflation’s effect on the economy’s size. Although real output has grown substantially, nominal GDP is considerably larger because of rising prices. For analysts and policymakers, this underscores the importance of using real GDP for growth assessments, as nominal figures can give an inflated sense of growth when inflation is high. Nominal GDP remains relevant for fiscal and financial analysis, such as budget revenue in current terms, but it should be interpreted alongside the deflator or real GDP to separate genuine production growth from price changes.
Descriptive Summary Statistics, 2000 to 2024
Over 2000 to 2024, Kenya’s economy expanded impressively in both current and constant terms. Nominal GDP increased from about Ksh 967.8 billion, 0.97 trillion, in 2000 to Ksh 16,224.5 billion, 16.22 trillion, in 2024. This is an increase by a factor of roughly 17 in nominal terms, a gain of over 1,500 percent. Real GDP, at 2016 prices, grew from approximately Ksh 982.9 billion in 2000 to Ksh 10,908.3 billion in 2024, reflecting a considerable rise in the volume of output over 25 years. The real GDP figures incorporate methodological updates, rebasing, but in broad terms the data indicate that real output in 2024 is around eleven times the real output of 2000. Even accounting for statistical discontinuities, Kenya’s economy is substantially larger in 2024 than in 2000 in real terms.
The average annual real GDP growth rate over the entire period was approximately 4.5 percent, suggesting a steady long-term trend. For context, median growth was around 5.0 percent, indicating that in a typical year the economy grew about five percent. There was only one year of contraction: 2020 saw a 0.3 percent decline, the sole negative year in the 25-year span. The fastest growth occurred in 2010, at 8.1 percent, while the slowest, apart from 2020, was essentially zero growth in 2000, 0.0 percent. Most years’ growth rates fell within a moderate band. About 15 out of 25 years saw growth between 3 and 6 percent. Only four years, including 2006, 2007, 2010, and 2021, experienced growth above 6 percent, showing that exceptionally high spurts were relatively rare. On the lower end, aside from 2020 and 2000, a few years, such as 2002 at 0.5 percent, 2003 at 2.9 percent, 2008 at 1.5 percent, and 2009 at 2.7 percent, recorded growth below 3 percent, often reflecting challenging conditions. Overall, the distribution points to an economy that, while subject to short-term shocks, maintained a solid pace of expansion over the long run.
From a price-level perspective, Kenya’s GDP deflator index in 2024 was about 149, with 2016 = 100. This indicates that the aggregate GDP price level in 2024 was roughly 1.49 times the level in the base year. Considering the period after the last rebase, 2009 to 2024, the deflator rose from about 61 to 149, an increase of 144 percent in 15 years, equivalent to average inflation of about 6.1 percent per year over that span. Compared to 2000, the deflator index value, 98 to 149, suggests roughly a 51 percent higher price level in 2024 than in 2000 for the GDP basket, though this comparison spans base-year changes. The key takeaway is that Kenya experienced substantial cumulative inflation alongside real growth. Nominal GDP growth, which averaged about 12 percent per year in this period, consisted of approximately 4 to 5 percent real growth and about 7 to 8 percent inflation per year on average, though rates varied year to year.
Between 2000 and 2024 Kenya’s economy expanded markedly in real terms, improving output and income levels, and experienced significant price increases. The data underline both the robust growth of economic activity, seen in rising real GDP and mostly positive growth rates, and the impact of inflation, seen in the growing gap between nominal and real GDP and a rising deflator. Together, these factors shaped the trajectory of Kenya’s GDP over the last quarter century.