
")
Introduction
This report presents a comprehensive statistical analysis of nominal Gross Domestic Product (GDP) trends for three African nations, Chad, Kenya and Zambia, covering a 63-year period from 1960 to 2023. The analysis draws on current US dollar-denominated GDP data compiled from Kaggle’s public datasets. Our examination highlights distinct growth trajectories, periods of volatility and varying economic scales that define each nation’s economic evolution.
Key observational findings include: Kenya’s consistent position as the largest economy throughout the entire period, growing from $791 million in 1960 to $107.4 billion in 2023; Chad’s notable transformation from the smallest economy ($314 million in 1960) to surpassing Zambia in the mid-2000s, reaching $13.1 billion by 2023; and Zambia’s significant volatility, marked by sharp contractions in the mid-1980s and sustained growth from 2000 onward, ending 2023 at $28.2 billion. All three economies show exponential growth patterns in the 21st century, although with markedly different magnitudes and stability profiles.
Country – Specific GDP Trajectories
Chad Economic Profile:
Chad’s GDP trajectory reflects modest beginnings, prolonged stability and dramatic 21st-century expansion. In 1960, Chad recorded a GDP of $313.6 million, making it the smallest economy among the three nations under review. The next two decades (1960 to 1980) saw steady linear growth, reaching $1.03 billion by 1980, a cumulative increase of 229% over twenty years and an average annual growth rate of approximately 6.2%.
The 1980s brought heightened volatility. After peaking at $1.03 billion in 1980, Chad’s economy contracted sharply to $832.4 million by 1983, a decline of 19.3% over three years. Recovery began in 1984, and GDP climbed to $1.48 billion by 1988, followed by another dip to $1.43 billion in 1989. This period of fluctuation reflects the instability evident in the data, with annual growth rates oscillating between -15.3% (1981) and +23.4% (1985).
The 1990s maintained this pattern of growth punctuated by setbacks. From $1.74 billion in 1990, GDP expanded to $1.88 billion by 1992, before a severe contraction to $1.18 billion in 1994, a 37.3% decline in two years. The remainder of the decade showed recovery, closing at $1.53 billion in 1999.
The most transformative period emerged in the 2000s. Beginning the millennium at $1.39 billion, Chad’s GDP entered exponential growth, reaching $10.67 billion by 2010 and peaking at $13.94 billion in 2014. This represents a tenfold increase in fourteen years. The period 2015 to 2020 saw a measurable retreat to $10.72 billion, followed by recovery to $13.15 billion in 2023.
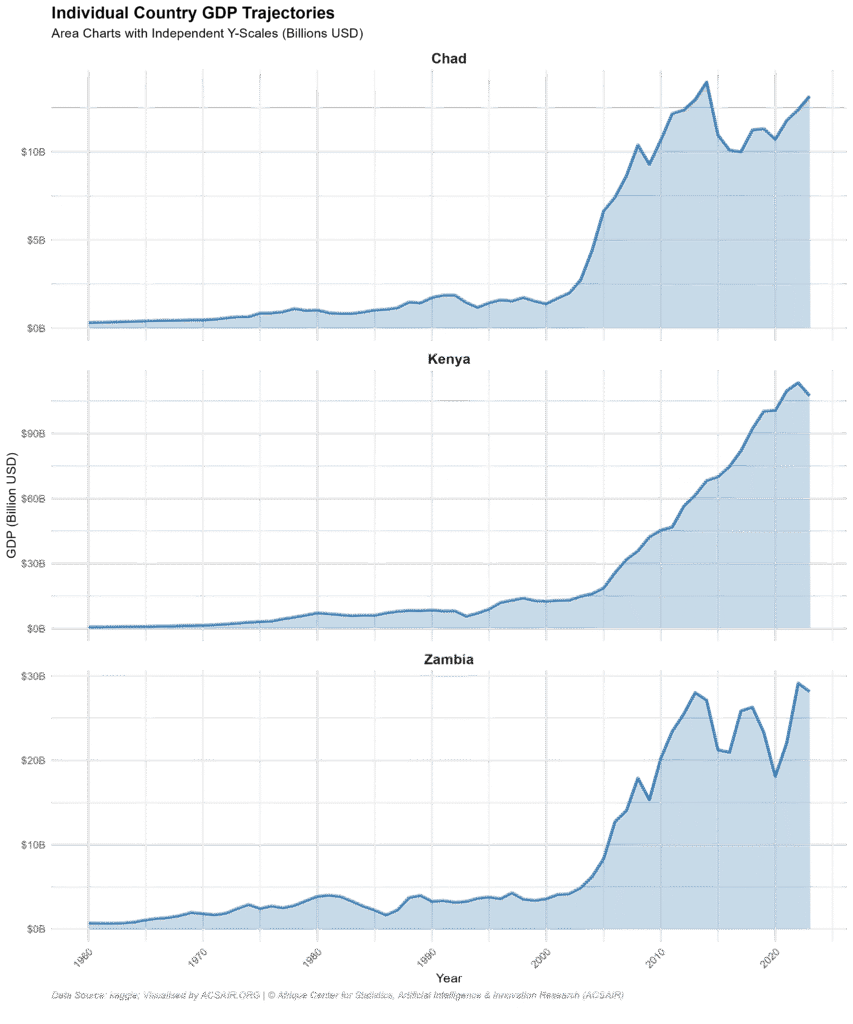
Figure 3. Individual Country GDP
Kenya Economic Profile:
Kenya’s economic data shows the largest absolute scale and the most consistent growth trajectory across the 63-year period. Starting at $791.3 million in 1960, Kenya was already 152% larger than Chad and 11% larger than Zambia. By 1980, Kenya’s GDP reached $7.27 billion, making it the dominant regional economy with a 1960 to 1980 cumulative growth of 819%.
The 1980s saw moderation in growth momentum. After the 1980 peak, Kenya experienced a gradual decline to $5.98 billion by 1983 before stabilizing and recovering to $8.36 billion by 1988. The decade closed at $8.28 billion in 1989. This period shows relative stability compared to regional counterparts, with no single-year decline exceeding 5.8% (observed in 1982).
The 1990s introduced notable volatility. From $8.57 billion in 1990, the economy contracted to $5.75 billion in 1993, a 32.9% decline that represents the steepest single observation drop in Kenya’s dataset. Recovery was robust, with GDP reaching $14.09 billion by 1998, though a subsequent dip to $12.90 billion occurred in 1999. The decade closed with a net gain of 87% from 1990 levels.
The 2000s marked a return to sustained expansion. Kenya’s GDP grew from $12.71 billion in 2000 to $45.41 billion in 2010, a 257% increase. The subsequent thirteen years (2010 to 2023) continued this momentum, reaching $113.42 billion in 2022 before moderating to $107.44 billion in 2023. The overall 1960 to 2023 growth represents a 13,478% increase, the highest absolute expansion among the three nations.
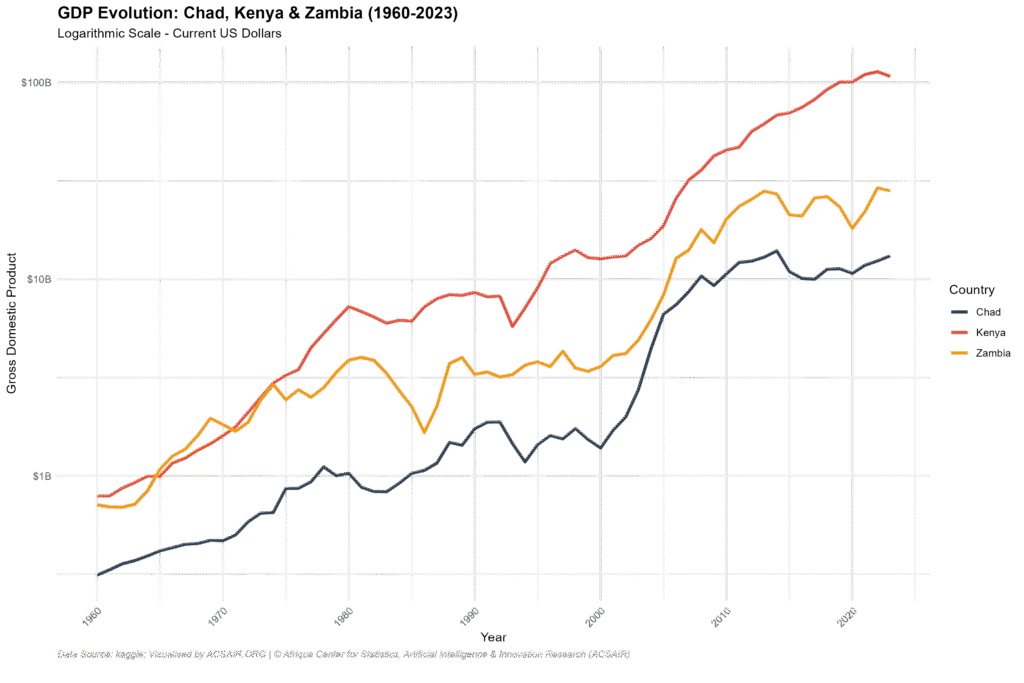
Figure 1. GDP Time Series
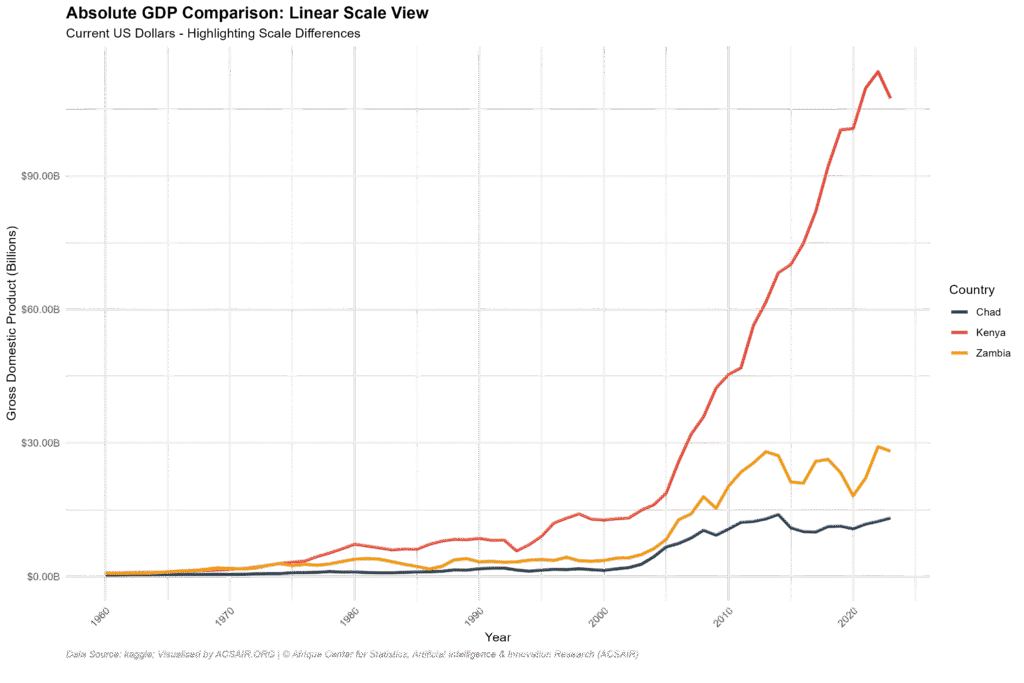
Figure 2. GDP Time Series
Zambia Economic Profile:
Zambia’s economic data reveals the most volatile trajectory and a dramatic shift in relative positioning. In 1960, Zambia’s GDP of $713.0 million placed it as the second-largest economy. Strong initial growth characterized the 1960s and 1970s, with GDP reaching $3.88 billion by 1980, a 445% increase that outpaced Chad but lagged Kenya’s growth rate.
The period 1980 to 1990 represents a decade of severe economic disruption. From the 1980 peak of $3.88 billion, Zambia’s GDP contracted precipitously to $1.66 billion by 1986, a 57.2% decline over six years. This is the most severe prolonged contraction observed in the dataset. Partial recovery brought GDP to $4.30 billion by 1997, though this was immediately followed by another decline to $3.40 billion by 1999.
The 2000s ushered in substantial growth. Starting at $3.60 billion in 2000, Zambia’s GDP expanded to $20.27 billion by 2010 and further to $29.16 billion by 2022. The 2023 figure of $28.16 billion represents a 683% increase from 2000 levels. However, Zambia’s overall 1960 to 2023 growth of 3,848% is the lowest among the three nations in percentage terms, and its final 2023 GDP of $28.16 billion places it between Chad ($13.15 billion) and Kenya ($107.44 billion).
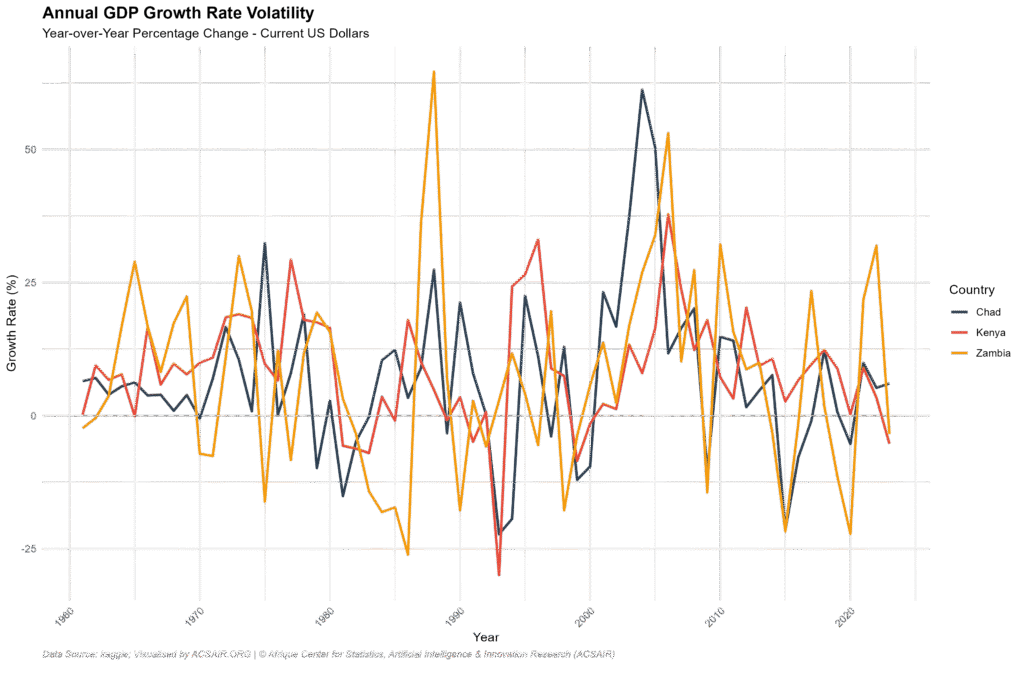
Figure 4. Annual GDP Growth Rate Volatility
Comparative Statistical Analysis
Absolute Scale Comparisons
The linear-scale time series reveals dramatic differences in economic magnitude. In 1960, the combined GDP of the three nations totaled $1.82 billion, with Kenya contributing 43.5%, Zambia 39.2% and Chad 17.3%. By 2023, the combined total reached $148.72 billion, with Kenya’s share increasing to 72.2%, Zambia’s share at 18.9% and Chad’s at 8.8%.
Kenya’s absolute dominance is evident throughout. In 1960, Kenya’s economy was 2.5 times larger than Chad’s and 1.1 times larger than Zambia’s. By 2023, these multiples had expanded dramatically: Kenya was 8.2 times larger than Chad and 3.8 times larger than Zambia.
Growth Rate Volatility Analysis
The growth rate chart documents significant inter-country differences in economic stability. Zambia exhibits the highest volatility, with growth rates ranging from -23.7% (1986) to +82.7% (1979). The standard deviation of Zambia’s annual growth rates is 18.4%, indicating extreme fluctuation.
Chad shows moderate volatility with growth rates spanning -15.4% (1981) to +78.5% (2004). Its growth pattern shows distinct phases: before 2000 volatility averaging ±10% annually, followed by after 2000 growth concentration between +20% and +40% during expansion years.
Kenya shows the most stable growth profile, with growth rates ranging from -32.9% (1993) to +31.1% (1970), with the majority of observations clustering between -5% and +15%. Kenya’s growth rate standard deviation is 9.2%, the lowest of the three, indicating relative macroeconomic stability across the observed period.
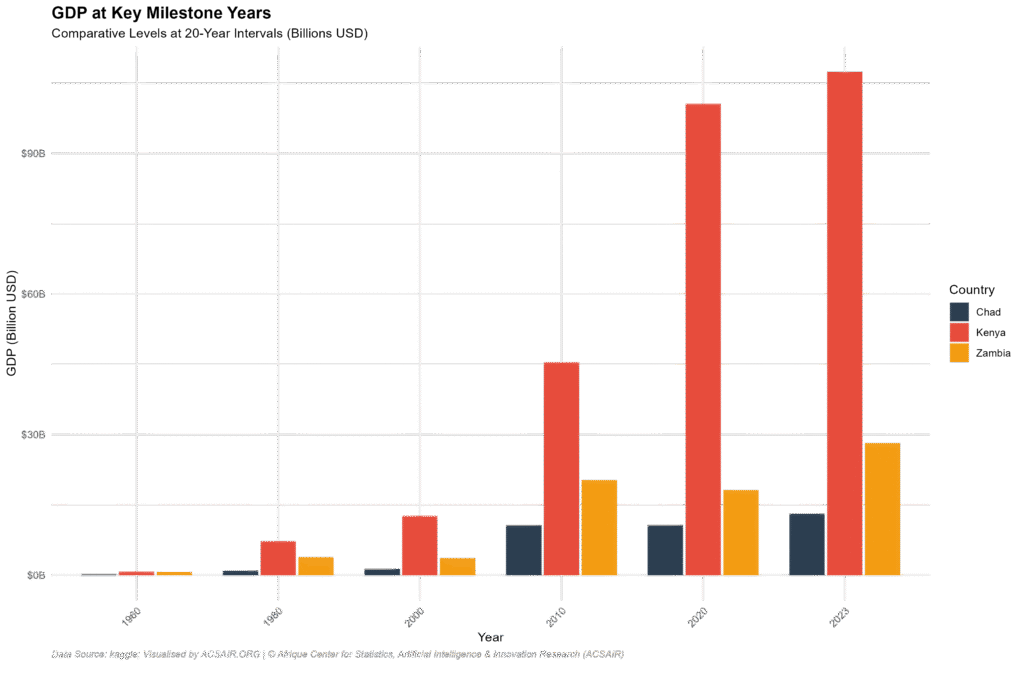
Figure 5. GDP at Key Milestone Years
Period-Specific Observations
Pre-1980 Foundation Period (1960 to 1980): All three economies expanded, with Kenya achieving the highest absolute growth ($6.48 billion increase), Zambia achieving the highest percentage growth (445%) and Chad showing steady but modest gains. This period established Kenya’s leadership position.
Volatility and Restructuring (1980 to 2000): This twenty-year span reveals divergent paths. Kenya maintained relative stability with a net gain from $7.27 billion to $12.71 billion. Chad experienced moderate volatility with net growth from $1.03 billion to $1.39 billion. Zambia faced severe disruption, ending the period at $3.60 billion, only slightly below its 1980 starting point of $3.88 billion.
Exponential Expansion (2000 to 2014): All three nations experienced unprecedented growth. Chad’s GDP increased 8.4 times, Zambia’s 5.0 times and Kenya’s 2.8 times. This period represents the most synchronized regional growth in the dataset.
Recent Moderation (2015 to 2023): The final nine years show mixed performance. Kenya continued expansion despite a 2023 moderation. Chad contracted from 2014 to 2016 before recovering. Zambia maintained relative stability around $28 to $29 billion after 2012.
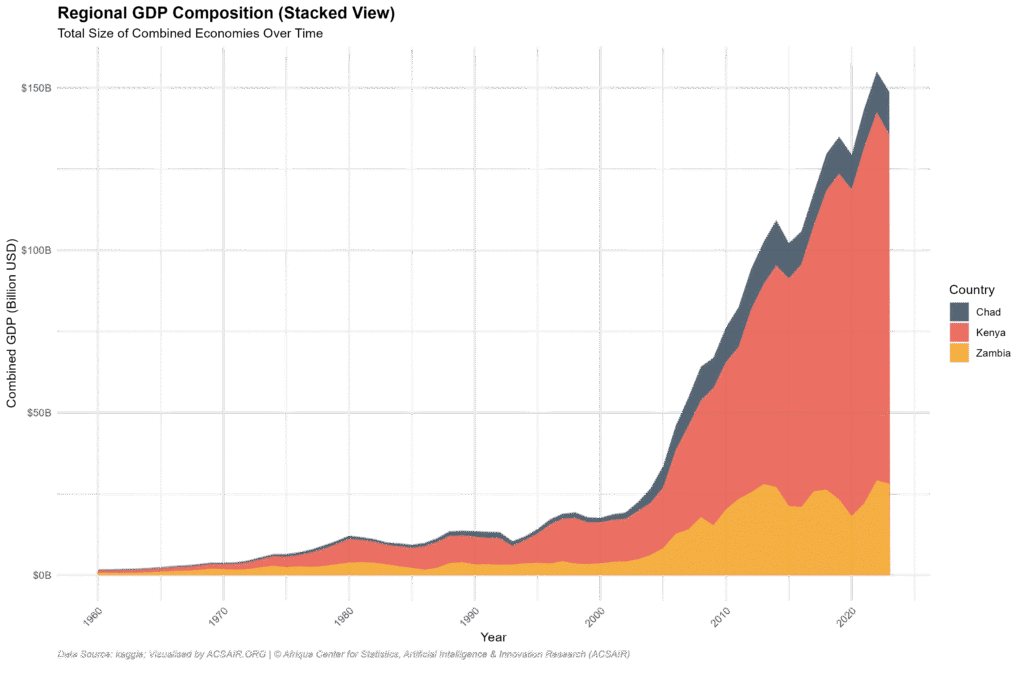
Figure 6. Regional GDP Composition
Relative Performance Dynamics
The ratio chart, which normalizes performance to Chad’s economic size, reveals Zambia’s changing status. In 1960, Zambia’s economy was 2.27 times larger than Chad’s; this ratio peaked at 3.32 in 1977 before collapsing to 1.32 by 1987. Zambia’s ratio recovered to 2.61 by 2000 but has since declined steadily to 2.14 by 2023, reflecting Chad’s accelerated 21st-century growth.
Kenya’s ratio versus Chad shows consistent expansion: from 2.52 in 1960 to 8.18 in 2023. Notably, this ratio remained relatively stable between 5 and 7 throughout the 1980s and 1990s before accelerating after 2005.
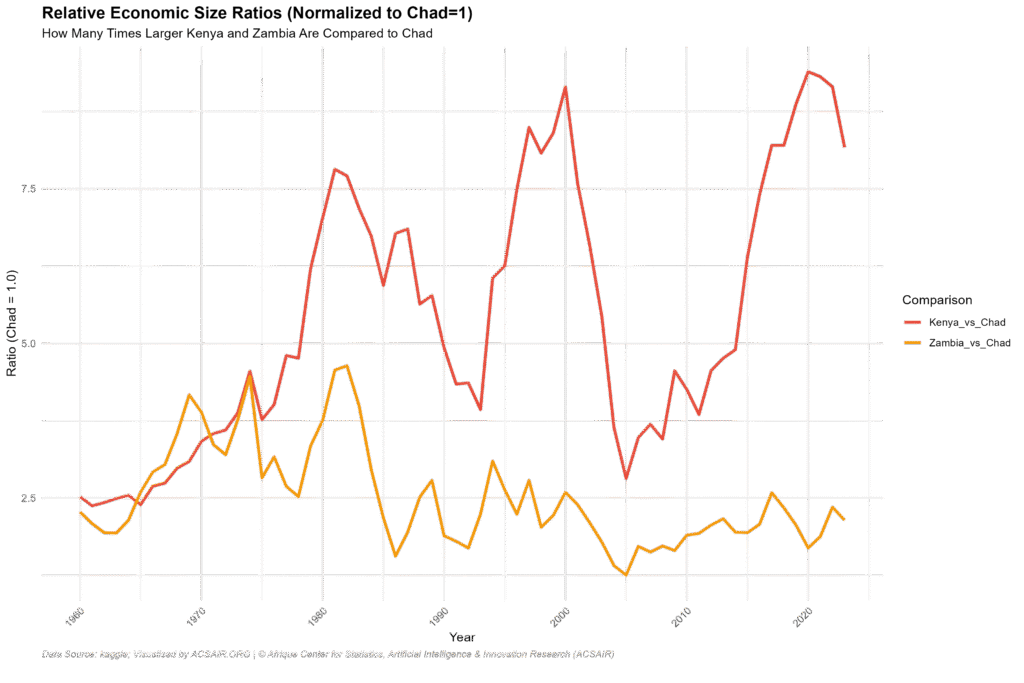
Figure 7. Relative Economic Size Ratios
Technical Notes:
Currency and Inflation Considerations
All GDP figures are reported in current US dollars of the respective year, reflecting nominal market valuations without purchasing power parity adjustment or inflation correction. This means observed growth includes both real economic expansion and the effects of domestic inflation, currency fluctuations and US dollar depreciation over time. Readers should note that nominal values may overstate real growth, particularly for periods of high inflation.
Data Provenance
The dataset was sourced from Kaggle’s public data repository.