

Introduction
This report presents an analysis of Nigeria’s international payments from October 2003 through August 2025. The data, obtained from the Central Bank of Nigeria, include three key components, Letters of Credit, Direct International Remittances, and Debt Service/Payments, all in U.S. dollars, along with a Total figure. In the early years, 2003 to 2013, data points were recorded more frequently, often weekly or biweekly, while from 2014 onward the values are reported monthly, generally at month end. All figures discussed are in USD. The following sections break down each component and the overall total, describing trends and notable observations without speculative conclusions or recommendations.
Letters of Credit (USD)
Letters of Credit represent one category of international payments and their values indicate the volume of trade finance or related transactions facilitated through letters of credit. Figure 1 shows monthly values from 2003 to 2025. Overall, Letters of Credit remained relatively modest for most of the period, especially compared with other components. In the mid-2000s, monthly values were often extremely low, frequently in the tens of thousands, or zero in several recorded periods. This indicates that in many weeks during 2007 to 2010, for example, there were either negligible or no transactions recorded under letters of credit.
From 2003 to around 2007, values were very low, often under a few hundred thousand USD per period, and sometimes zero. A notable change occurs around 2008, with a dramatic spike in October 2008 when Letters of Credit reached approximately $1.35 billion in a single entry, by far the highest value for this category in the dataset. This spike in late 2008 stands out sharply from surrounding periods and suggests a one-time surge, for instance large import financing transactions may have been settled then, although the data provide no explanatory details. Following October 2008, values in late 2008 remained elevated, with additional entries in October and November 2008 on the order of $600 to $650 million, before subsiding.
In the years after 2008, Letters of Credit generally returned to much lower levels. Through the early to mid-2010s, typical monthly values ranged from a few million to a few tens of millions of USD. There were many months under $50 million. This relatively low level persisted until the late 2010s, when the data show another increase. In 2018, values rose significantly. December 2018 recorded about $632.8 million, a very high value, the second largest in the series after the 2008 spike, suggesting another year-end surge. Aside from that event, the late 2010s saw moderate growth, for example the monthly average in 2018 was around $86 million, higher than in previous years.
Entering the 2020s, Letters of Credit continued to fluctuate. In the early 2020s, values were generally in the tens of millions of dollars per month. There was a peak in 2022, when the average monthly issuance rose, 2022 averaged over $100 million per month and some months exceeded $170 million. This indicates increased activity relative to immediately preceding years. By 2024, monthly figures had settled back to about $50 to $80 million for many months. As of mid-2025, Letters of Credit were roughly $65 to $80 million per month, for example about $69.0 million in August 2025. Overall, aside from the exceptional spikes in 2008 and 2018, Letters of Credit have remained the smallest of the three components throughout the period, usually contributing a minor share to the total.
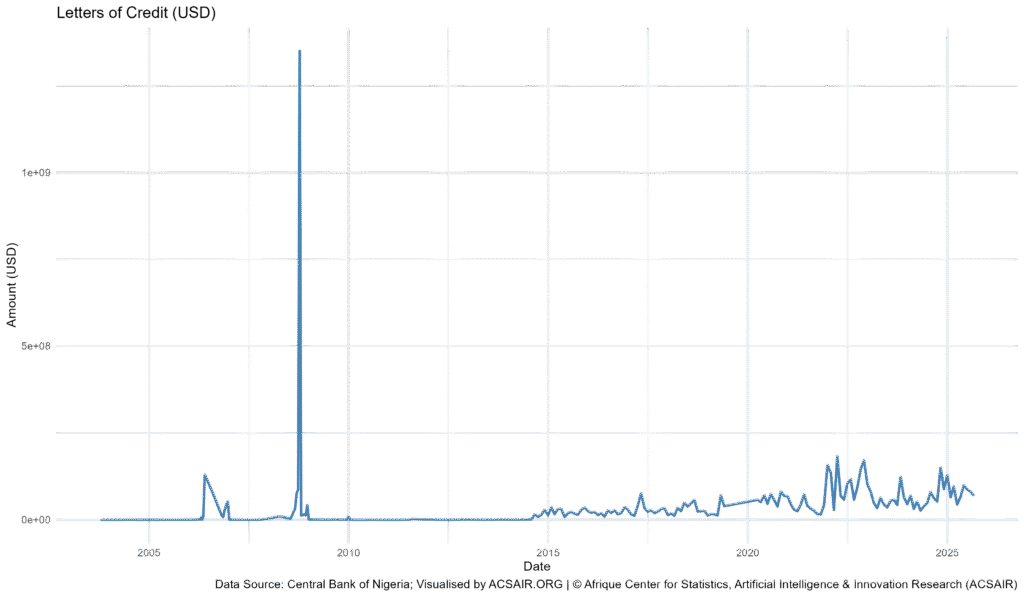
Figure 1: Letters of Credit (USD) from October 2003 to August 2025.
Direct International Remittances (USD)
The Direct International Remittances category captures cross-border remittance flows, typically funds sent by individuals to or from Nigeria. Figure 2 illustrates the trend from 2003 to 2025. In contrast to letters of credit, remittances grew to become a very large component, especially during the mid-2010s.
During the mid-2000s, values were modest, often in the tens or low hundreds of millions of USD on a monthly basis, with more frequent data in that period, individual weekly entries in 2006 to 2007 commonly below $100 million. There were occasional higher figures in the late 2000s; for example, in 2007 some weekly entries reached a few hundred million USD. The most striking growth occurred in the 2010s. Remittances show a clear rising trend through the early and mid-2010s; by 2013 and 2014, monthly totals, once the data became monthly, were regularly in the hundreds of millions. This growth culminated in the second half of the 2010s, when remittances became exceptionally large.
The peak of remittance flows is observed around 2016 to 2017. December 2016 recorded approximately $3.71 billion for that single month, the highest remittance value in the dataset. Throughout 2016, remittances were very high, the monthly average was around $580 million, skewed by the year-end spike; several months in 2016 were in the high hundreds of millions and December was over three billion. In 2017, remittances remained substantial, for instance an average of about $674 million per month. The upward trend continued into 2018 and 2019, during which flows were consistently elevated. In 2019, monthly remittances averaged roughly $1.6 billion, indicating that remittances were the dominant contributor to international payments. Many months in 2018 to 2019 saw inflows around $1 to $2 billion, a massive increase compared with earlier years.
After 2019, there was a dramatic decline. Starting in 2020, remittances dropped sharply. The year 2020 shows significantly lower figures compared with 2019. For example, while January 2020 was about $2.05 billion, one of the larger single-month values, by later in 2020 the monthly figures fell off; the annual average for 2020 was under $500 million per month. The decline became more pronounced in 2021, when remittances averaged only about $202 million per month, a fraction of their level two years prior. In absolute terms, monthly figures in 2021 were mostly in the low hundreds of millions, or below $200 million. This lower level persisted through the mid-2020s: 2022 averaged approximately $180 million per month, 2023 around $165 million and partial data for 2025 suggests further decline, with the first eight months of 2025 averaging roughly $84 million per month. By mid-2025, monthly remittances had dwindled to roughly $100 million or less, for example about $107.6 million in August 2025.
Direct International Remittances grew steadily in the 2000s and early 2010s, surged to very high levels in the mid to late 2010s, peaking in 2016 to 2019, then experienced a steep fall in the 2020s. During their peak, remittances were by far the largest component of international payments, but in recent years they have become much smaller, both in absolute terms and relative to the other components.
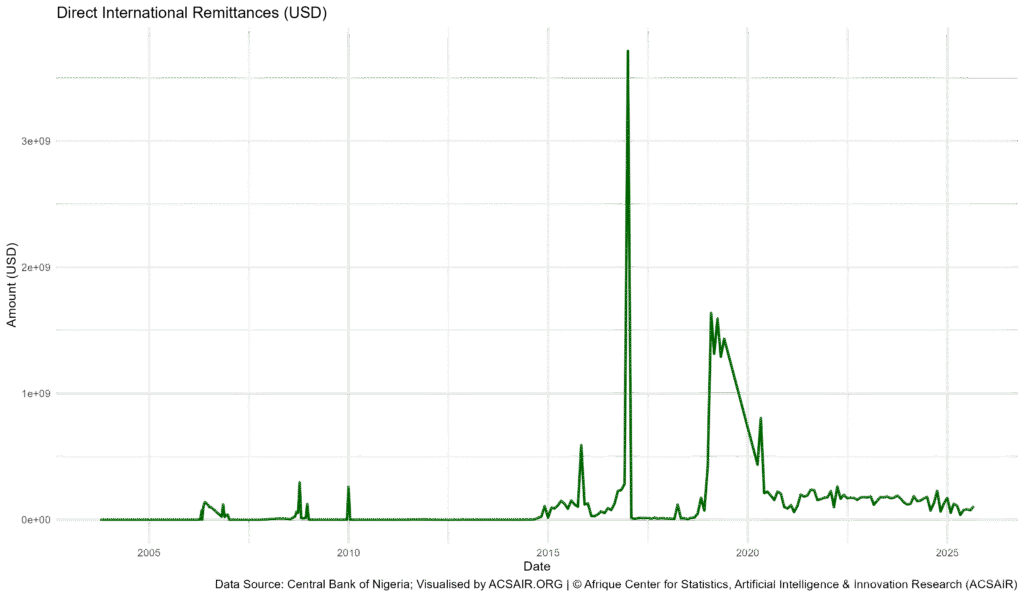
Figure 2: Direct International Remittances (USD) from October 2003 to August 2025.
Debt Service/Payments (USD)
The Debt Service/Payments category reflects payments on external debt obligations, such as principal and interest on foreign debt. Figure 3 shows the trajectory from 2003 to 2025. This component exhibits a different pattern from the other two, with relatively low levels for an extended period followed by a surge in the late 2010s and early 2020s.
In the mid-2000s, debt service payments were generally moderate, with many entries showing tens of millions of USD. Notably, there was an early spike in November 2006, when a payment of approximately $1.52 billion was recorded, on 10/11/2006. That value stands out in the 2000s and likely corresponds to a one-time large debt settlement. Apart from that spike, the period from 2003 through roughly 2015 saw relatively subdued figures. For much of 2007 to 2014, monthly or weekly payments were often a few million to a few tens of millions of dollars. In some years immediately after 2006, payments were minimal, reflecting a period when external debt servicing requirements were lower, for instance in several quarters of 2007 to 2010, the data show zeros or very small amounts.
Starting around 2015, the category began to rise. By 2016, there was a noticeable increase in regular payments, even though 2016’s average was still only about $29 million per month, higher than near-zero levels of the late 2000s. The growth becomes clearer in 2017 to 2019, for example in 2018 the average was about $122 million per month, and in 2019 a similar average, approximately $111 million per month, was observed. These figures indicate that by the late 2010s, debt service obligations were growing, resulting in larger and more frequent outflows.
The most significant surge occurred in 2020. In February 2020, the data record an exceptionally large outflow of about $4.43 billion, on 29/02/2020, the highest single debt payment in the dataset. This huge payment caused the 2020 average to jump sharply, the year averaged roughly $480 million per month, far above previous years. This suggests that early 2020 saw a major payment, or series of payments, that dwarfed typical monthly amounts. After that spike, payments remained significantly elevated relative to the past. In 2021, the average was approximately $177 million per month; in 2022, about $208 million per month; and this rising trend continued through 2023 and 2024, with averages of roughly $292 million and $388 million per month, respectively. By 2024, monthly debt service payments were regularly in the several hundred million dollar range, for instance December 2024 was about $328.9 million, and many other months in 2024 were in the $250 to $500 million range. Partial data for 2025 show a continued high level, averaging around $358 million per month in the first eight months of 2025. In August 2025, the payment was roughly $302.3 million.
Aside from an isolated large payment in 2006, Debt Service/Payments remained low through the late 2000s and early 2010s, then climbed dramatically from the late 2010s. By the mid-2020s, debt service had become a major component of international payments, reflecting substantially higher obligations than a decade earlier.
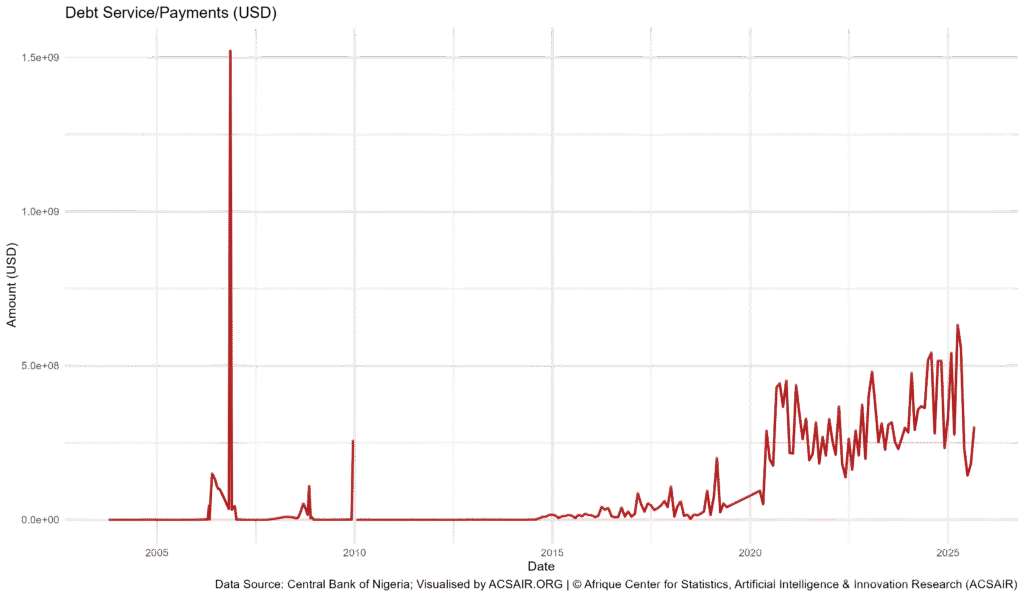
Figure 3: Debt Service/Payments (USD) from October 2003 to August 2025.
Total International Payments (USD)
The Total international payments represent the sum of all recorded outflows in the dataset, which include the three categories discussed above and in earlier years may implicitly include other unspecified components as well. Figure 4 depicts total international payments over time from 2003 to 2025. This total provides an overarching view of how aggregate flows have changed and it reflects shifts in the relative importance of letters of credit, remittances and debt service over the years.
In the early part of the period, the mid-2000s, total payments per period were relatively moderate. For example, throughout 2005 to 2007, total flows in each recorded period were often well below $1 billion and in many cases only a few hundred million or less. One exception in the early data is an outlying total value in October 2006, about $2.13 billion, likely driven by the large debt payment mentioned earlier. Ignoring such anomalies, the general level was a few hundred million USD per month in the mid to late 2000s.
Starting in the 2010s, totals began to increase substantially. By the mid-2010s, totals frequently reached the low billions. There was a pronounced surge around 2015: the single highest total, aside from the data error omitted in 2006, occurs in October 2015, when total international payments reached approximately $7.23 billion for that month. This spike is remarkable, suggesting a huge aggregate outflow. Notably, the components recorded for that month, letters of credit about $28 million, remittances about $590 million, debt service about $19.7 million, sum to only a small fraction of the $7.23 billion total, indicating that other payment components, not individually detailed in the dataset, must account for the remainder. Such a value could correspond to extraordinary transactions or adjustments. Aside from that peak, 2014 to 2015 generally show a rising trend in totals, driven largely by increasing remittances and some increase in other outflows.
The late 2010s continued this trend. In 2018, total payments averaged about $1.15 billion per month, and in 2019 the average rose to approximately $1.77 billion, the highest yearly average in the series. During 2018 to 2019, totals were consistently high, reflecting the combination of very large remittance figures and growing debt service, with letters of credit contributing a smaller share. For instance, in November 2019 total payments were about $1.58 billion, largely attributable to over $1.3 billion in remittances that month.
A significant shift occurred after 2019, mirroring the drop in remittances and the rise in debt service. In 2020, totals show a mixed pattern: early 2020 saw a spike, February 2020 was about $5.48 billion, boosted by the record debt service payment and still strong remittances in January and February, but by later 2020 the totals came down. The average for 2020 was around $997 million per month, roughly half the 2019 level. The decline became more pronounced in 2021, when total international payments averaged only about $237 million per month, a sharp reduction corresponding to the collapse in remittance inflows that year; despite moderate debt payments, the absence of large remittances pulled the total down drastically. In fact, 2021 represents a low point in aggregate outflows for the 2010s to 2020s period.
After 2021, there is a gradual recovery. In 2022, total flows picked up to about $501 million per month on average, then to about $566 million in 2023. By 2024, total international payments averaged roughly $620 million per month. This rebound is primarily due to increasing debt service payments, since remittances remained relatively low and letters of credit had only modest growth. The composition of the total in the mid-2020s differs markedly from that of the mid-2010s. Whereas in 2015 to 2016 remittances dominated the total, for example in December 2016 remittances made up nearly all of the $3.75 billion total, by 2024 the largest share came from debt service. As an illustration, in August 2025 total international payments were about $478.9 million, of which roughly 63 percent was debt service, 22 percent remittances, and 14 percent letters of credit. This contrasts with December 2016, where the total, about $3.75 billion, was 99 percent remittances. Over the two-decade span, Nigeria’s international payment profile shifted from heavily remittance driven in the late 2010s to heavily debt service driven in the mid-2020s.
Total International Payments rose to very high levels in the mid to late 2010s, peaking around 2015 to 2019, then fell sharply in the early 2020s, and stabilized at a moderate level by the mid-2020s. The balance between components changed markedly: earlier, remittances were the primary contributor to total outflows, whereas more recently, debt service payments have become the dominant component.
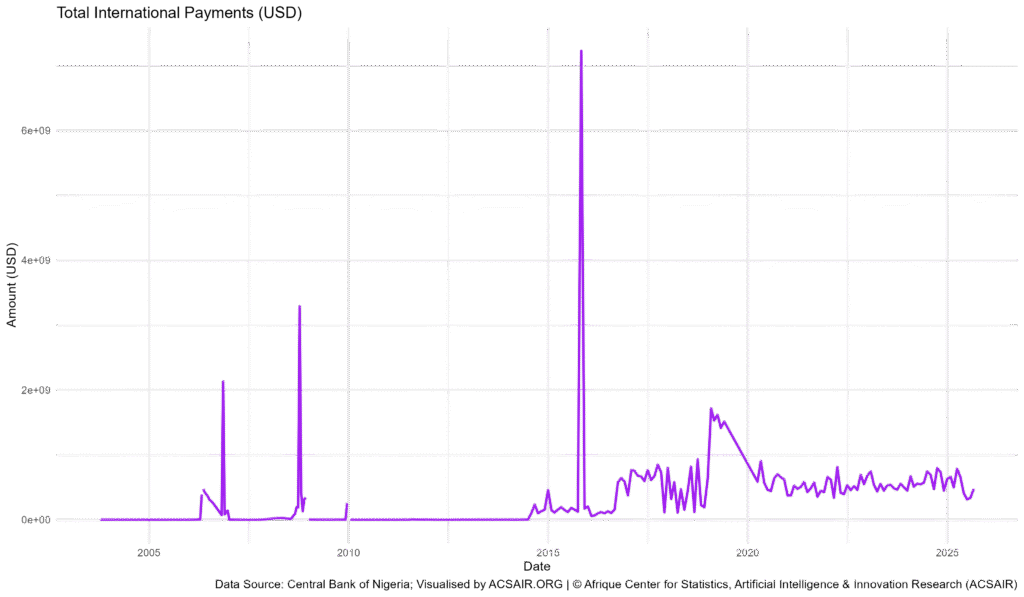
Figure 4: Total International Payments (USD) from October 2003 to August 2025.
Conclusion
The data from October 2003 to August 2025 show how the landscape of Nigeria’s international payments has evolved. Letters of Credit have generally remained the smallest segment, with occasional surges, notably in 2008 and 2018, but otherwise relatively stable and modest levels. Direct International Remittances grew through the 2010s, becoming the largest component by the end of that decade, before a precipitous decline in the 2020s. In contrast, Debt Service/Payments were minimal for many years, then rose in the late 2010s, culminating in significant outflows by the mid-2020s. As a result of these shifts, Total international payments peaked in the late 2010s and then decreased, with the burden of total outflows moving from remittance heavy to debt heavy.
By the mid-2020s Nigeria’s international payment outflows are much lower than the peaks of a few years prior, but the composition indicates growing debt servicing costs and much reduced remittance inflows compared with their heyday. Each category’s trend provides insight into different economic facets, trade finance, letters of credit, diaspora and international transfers, remittances, and external debt obligations, debt service. This report, compiled by the Afrique Center for Statistics, Artificial Intelligence & Innovation Research, ACSAIR, presents a factual breakdown of these trends as recorded, offering a clear picture of how each component has contributed to Nigeria’s international payments over the past two decades.